The ultimate guide for updating your Looker Studio dashboards to GA4
By: Kyle Gellatly
May 26, 2023 | Reading Time: 7 mins
If you’re anything like us, we love Looker Studio (formerly Data Studio) reporting dashboards and rely on them to make our monthly insights a heckuva lot more efficient.
When we heard that Google was going to sunset Universal Analytics (UA) and solely support Google Analytics 4 (GA4) going forward, one of the first things we thought was: “Aaahhh! Now we’re going to have to update and rebuild all of our current Looker reports on top of migrating to GA4😱”. Whether we like it or not, Google Analytics 4 is the future so the migration has to happen.
Here’s what you can expect
To help ease some changeover anxiety, we’ve put together a list of key things marketers should know when switching reports over to GA4:
- Anticipating the time needed for migrating dashboards
- Learning new Engagement metrics
- UA vs GA4 changes cheat sheet
- ‘How to’ instructions for updating conversions and calculations
- Using Regex to manipulate data
- Use dashboards as a way of identifying issues with your overall GA4 migration
Spoiler Alert: It’s not nearly as tough as you think. Yes, GA4 does some things a bit differently, but you don’t have to be a GA4 expert to migrate your existing dashboards over.
How long does it take to migrate Looker dashboards from UA to GA4?
It really depends on the complexity of your Looker Studio dashboards and what data they pull in. In our experience, we were able to migrate our UA dashboards over to GA4 in a few hours. Our migration included updating some of the following:
- Google Analytics data sources
- Blended data and tables
- Conversion goals
- KPI widgets
The time investment needed to make the switch looks different for everyone. It also depends on the number of dashboards you’re working with. Do an inventory of your dashboards to gauge how much time you may need.
Introducing new GA4 engagement metrics
If there’s one thing GA4 is championing more than anything else, it’s engagement.
Engagement is a key factor in Google’s search algorithm and every year since 2016 Google has been increasing the importance of engagement for ranking.

With engagement carrying more weight in the algorithm, Google wants to make it easier for us to optimize our content for it. That’s why they created new engagement metrics like User Engagement, Engaged Sessions, and Engagement Rate. Here’s what each of these metrics means:
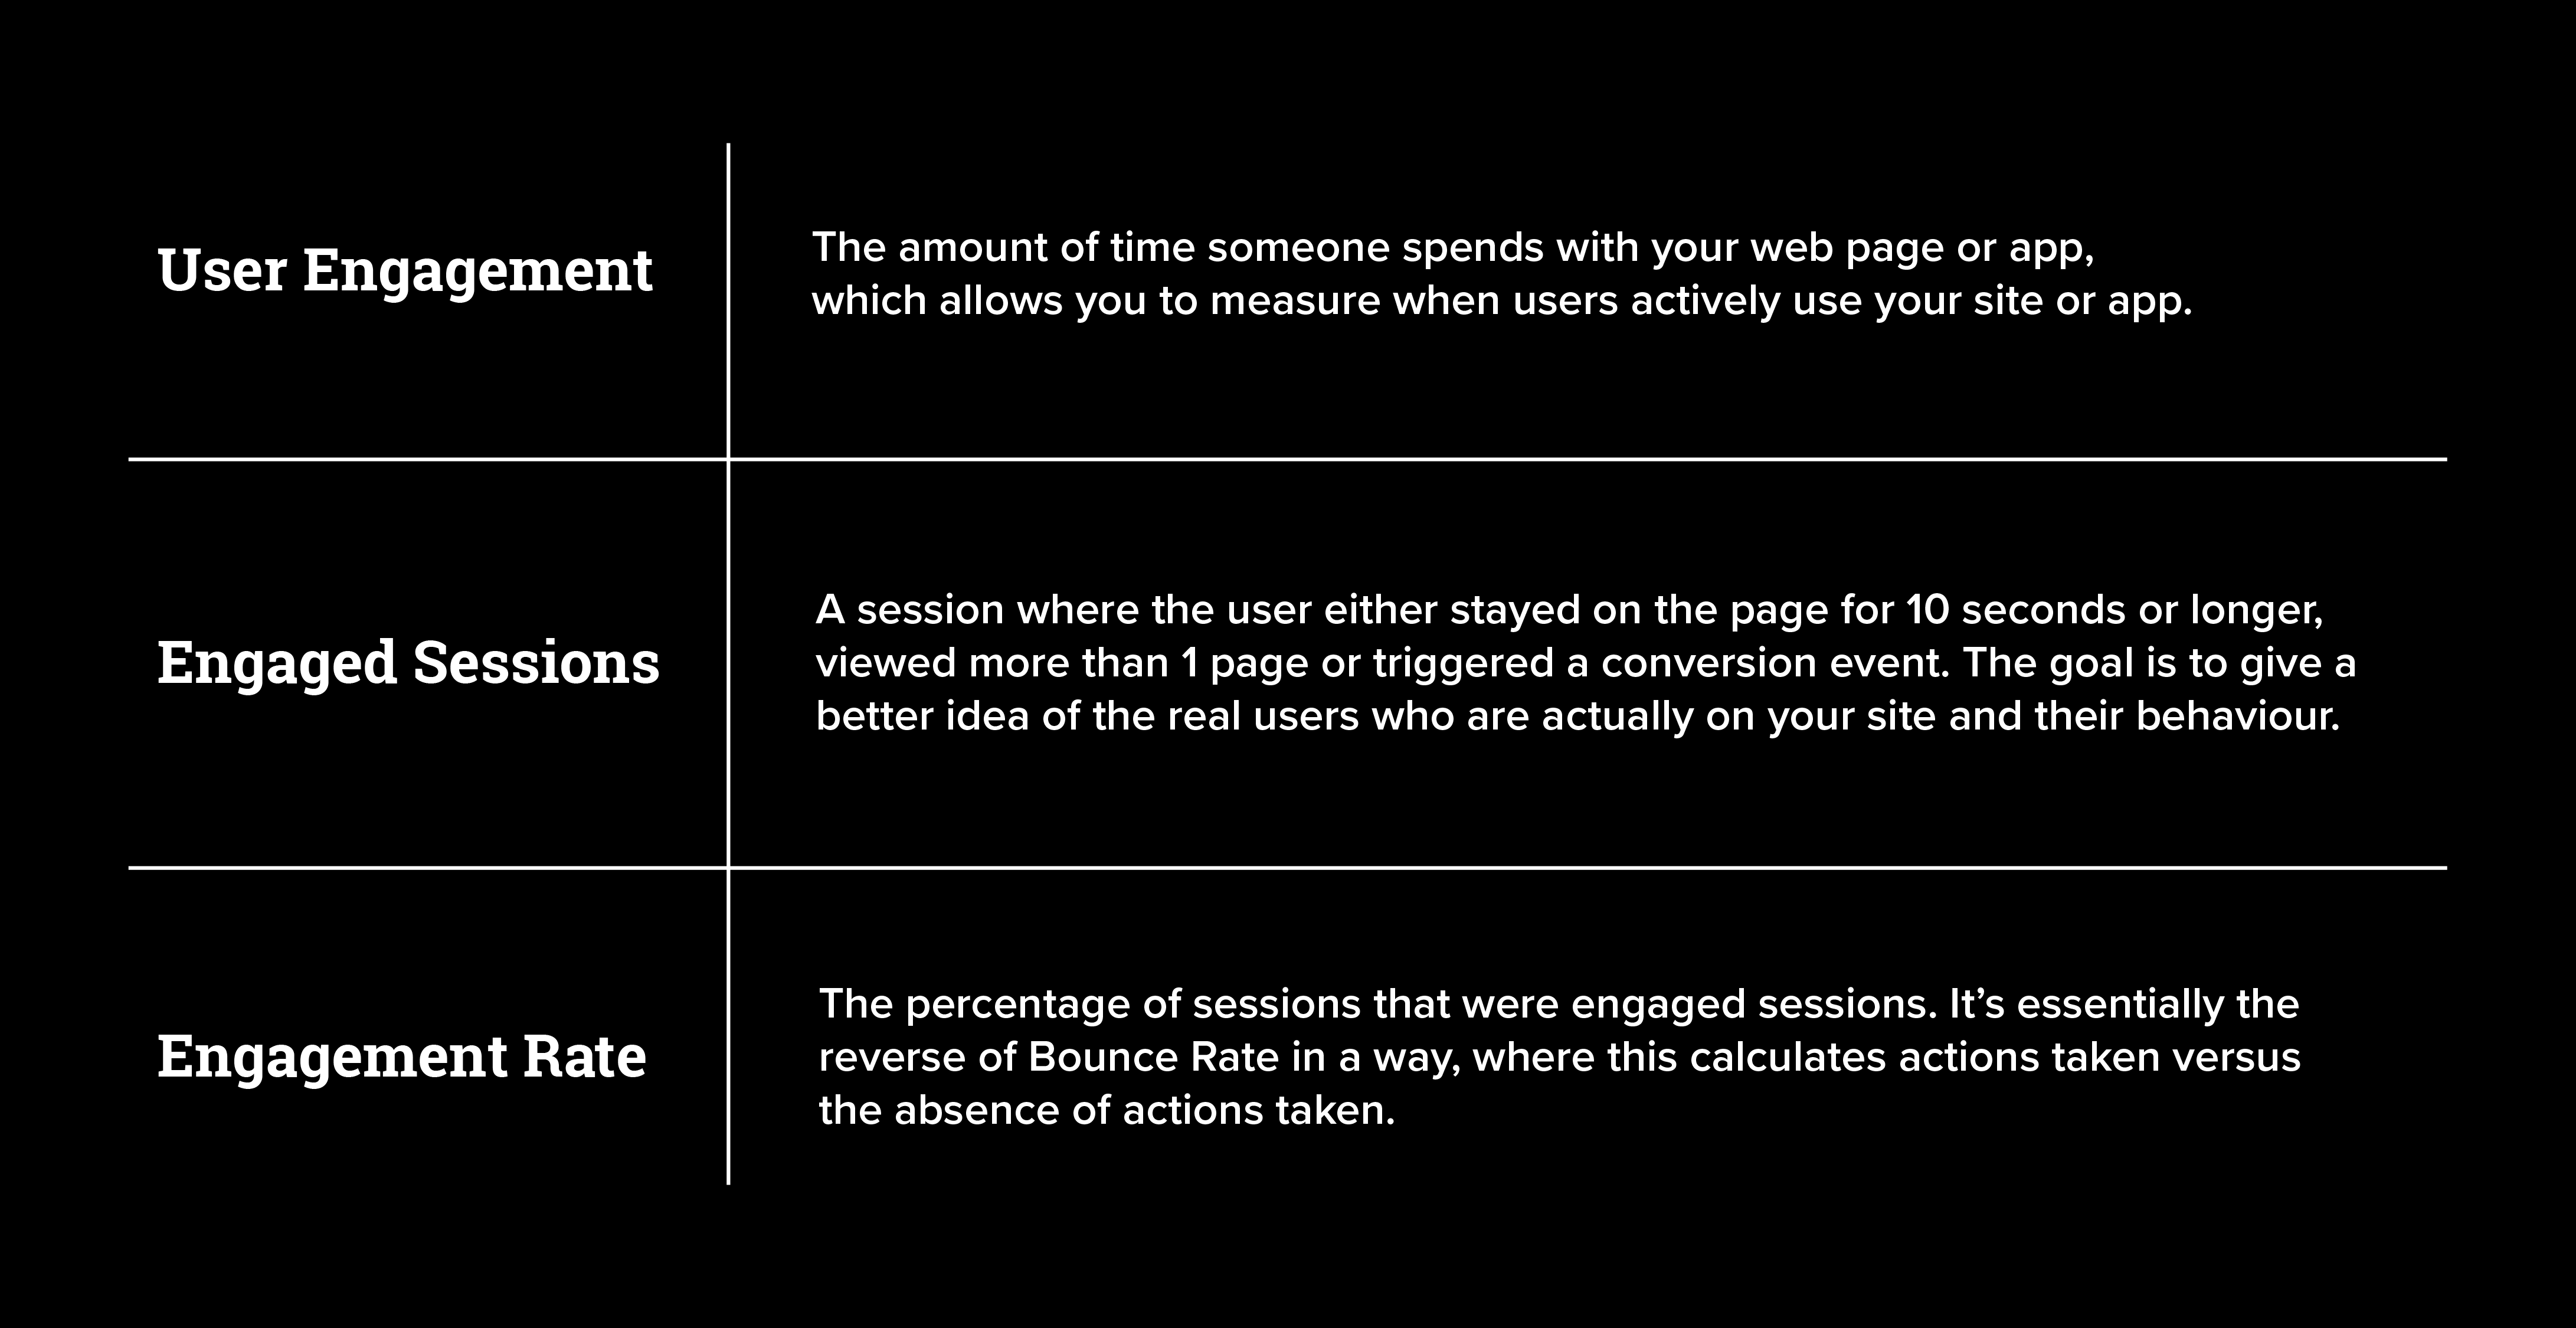
Naturally, these metrics create new questions for marketers, like what’s considered good engagement? What are the benchmarks for my particular industry? Many are already trying to calculate average Engagement Rates by industry for B2B firms with a minimum of 63% being noted as good engagement in B2B as a whole.
UA vs GA4 changes cheat sheet
Renamed metrics and dimensions
The following metrics still exist within GA4, they’ve just been renamed. When looking to map your existing UA data with GA4 data, knowing the new names will be key! When migrating your UA fields in Looker Studio to GA4, make sure to select the new metric/dimension name after you change over the data source.
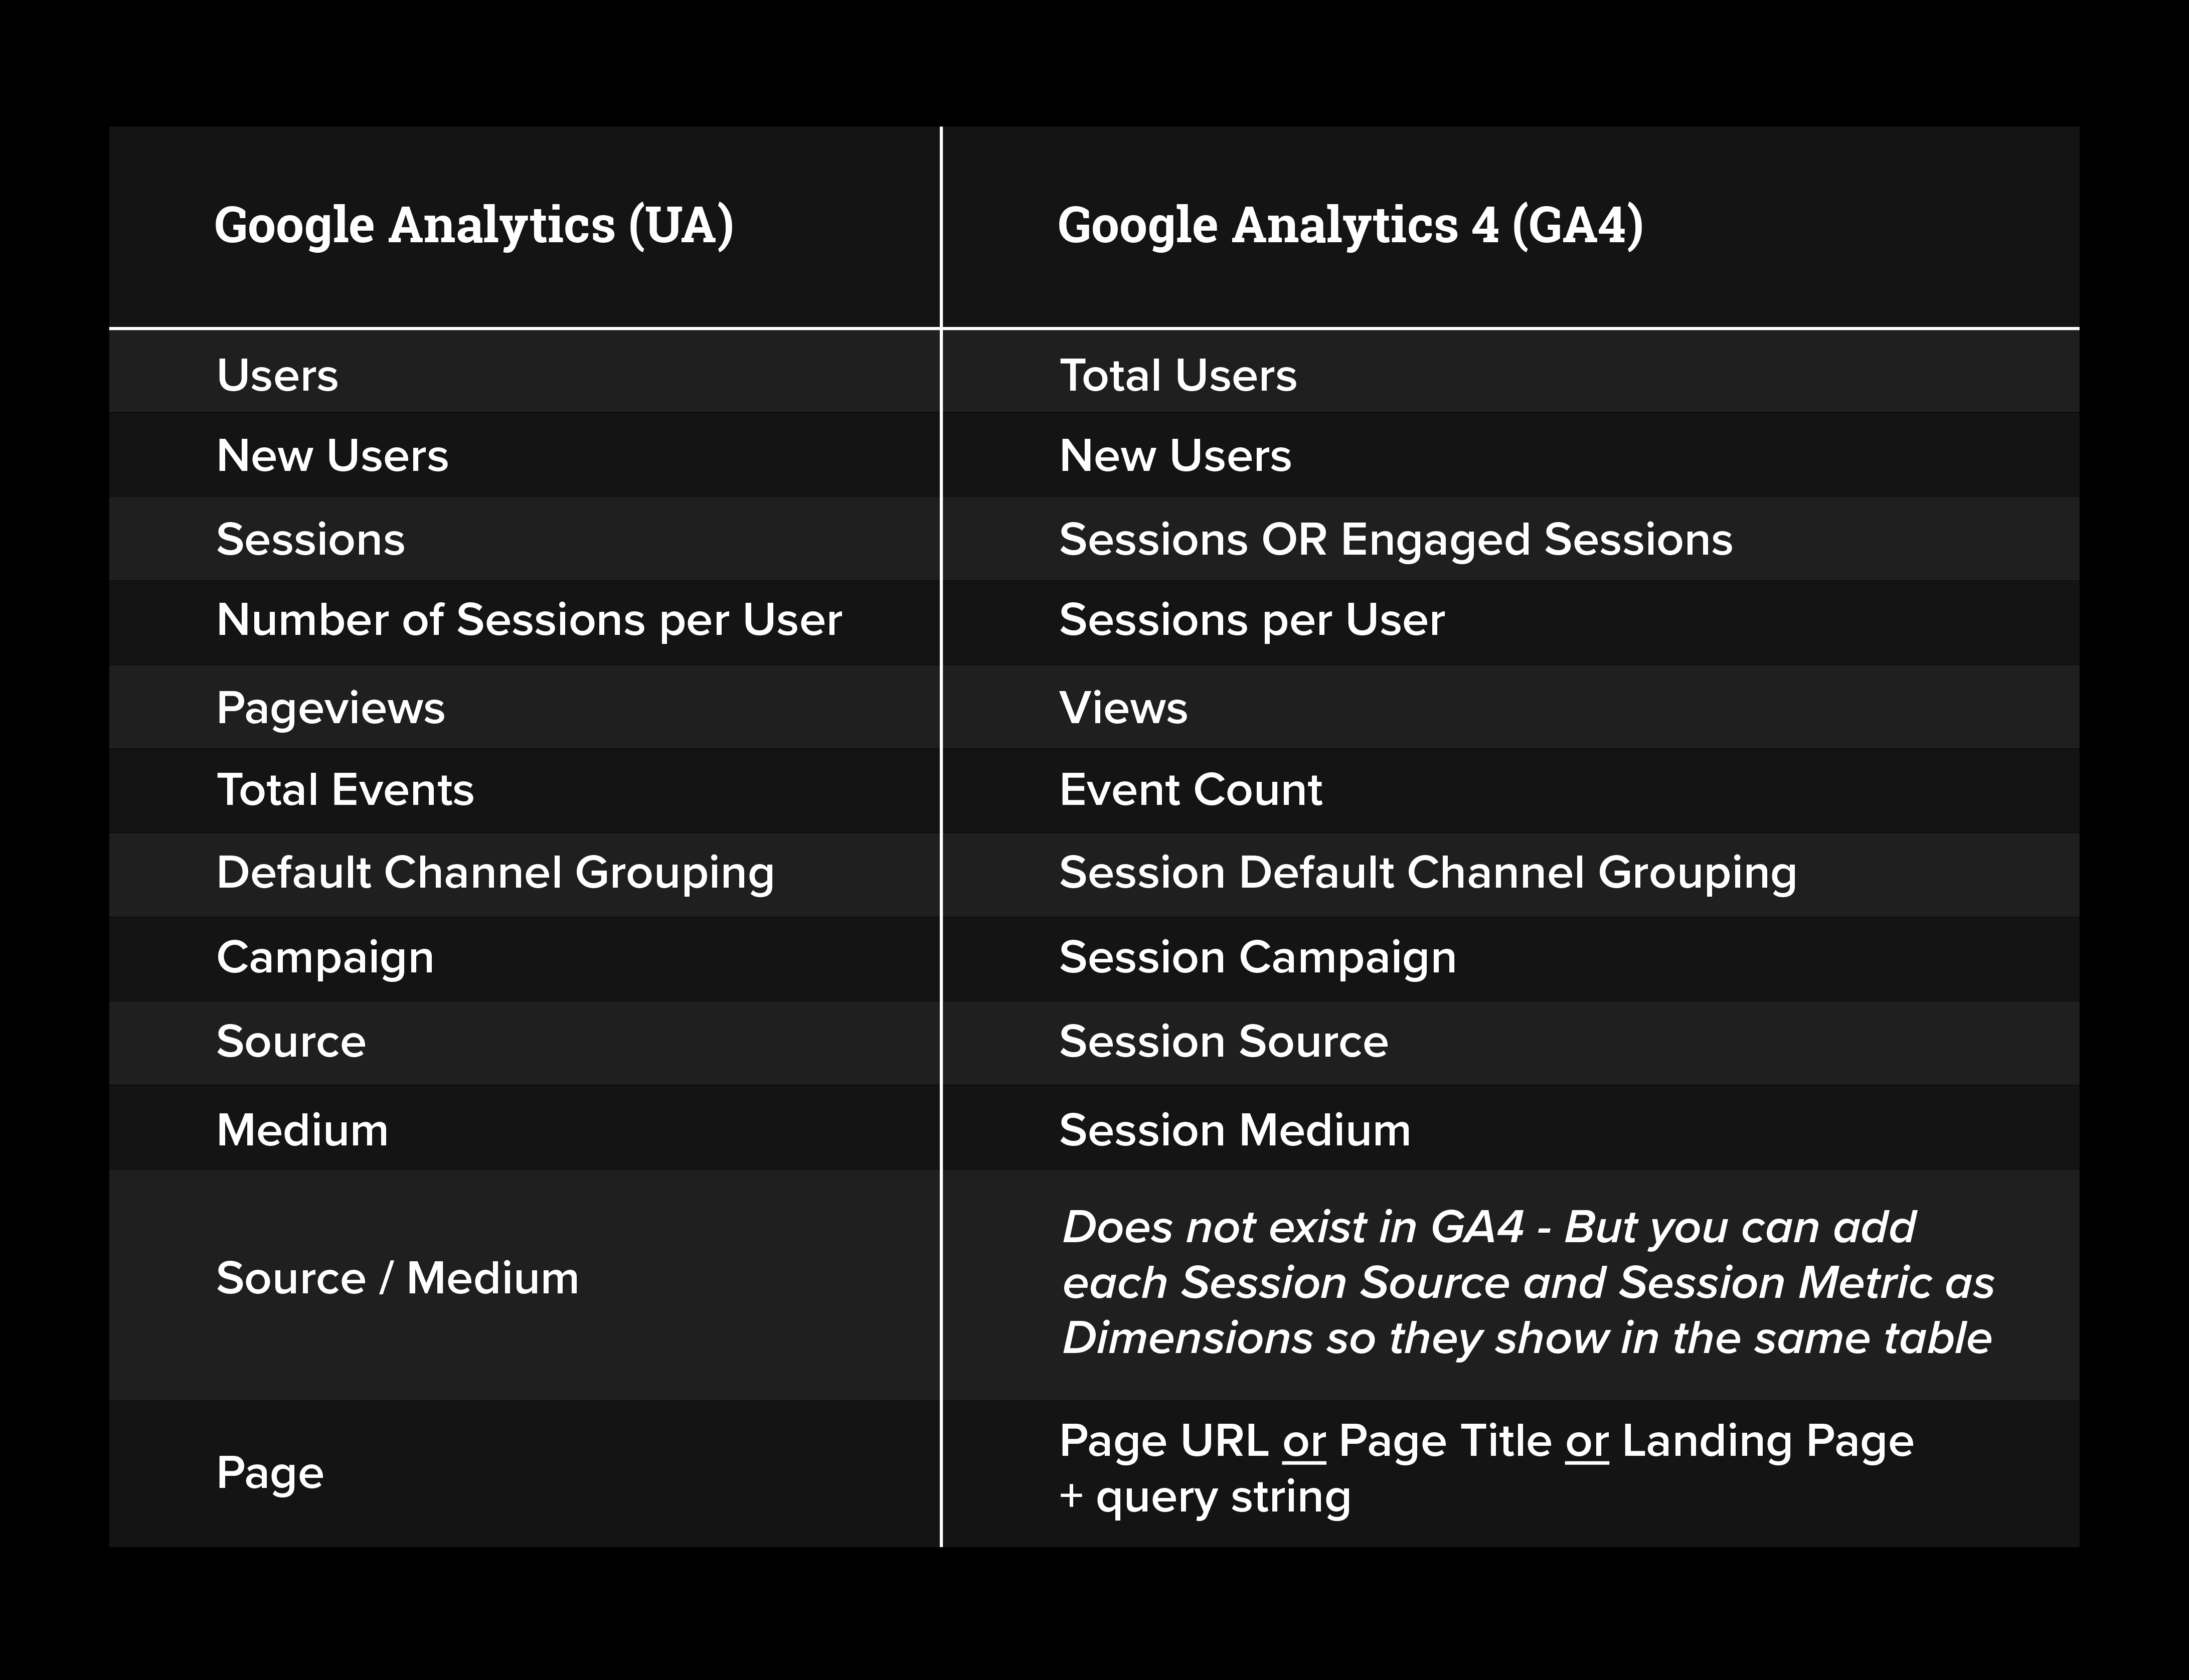
UA vs. GA4 metrics and dimensions calculations
With certain metrics like ‘Bounce Rate’ going away or being swapped, our spidey senses tell us there’s a sense of panic. No need! A number of UA metrics can still be calculated. You can get the data you want—it just takes a few extra steps.
Here’s what’s different and what you may need to set up a calculation for pending on the data that’s important to you. Don’t worry, we’ve also outlined how to set up calculations below.
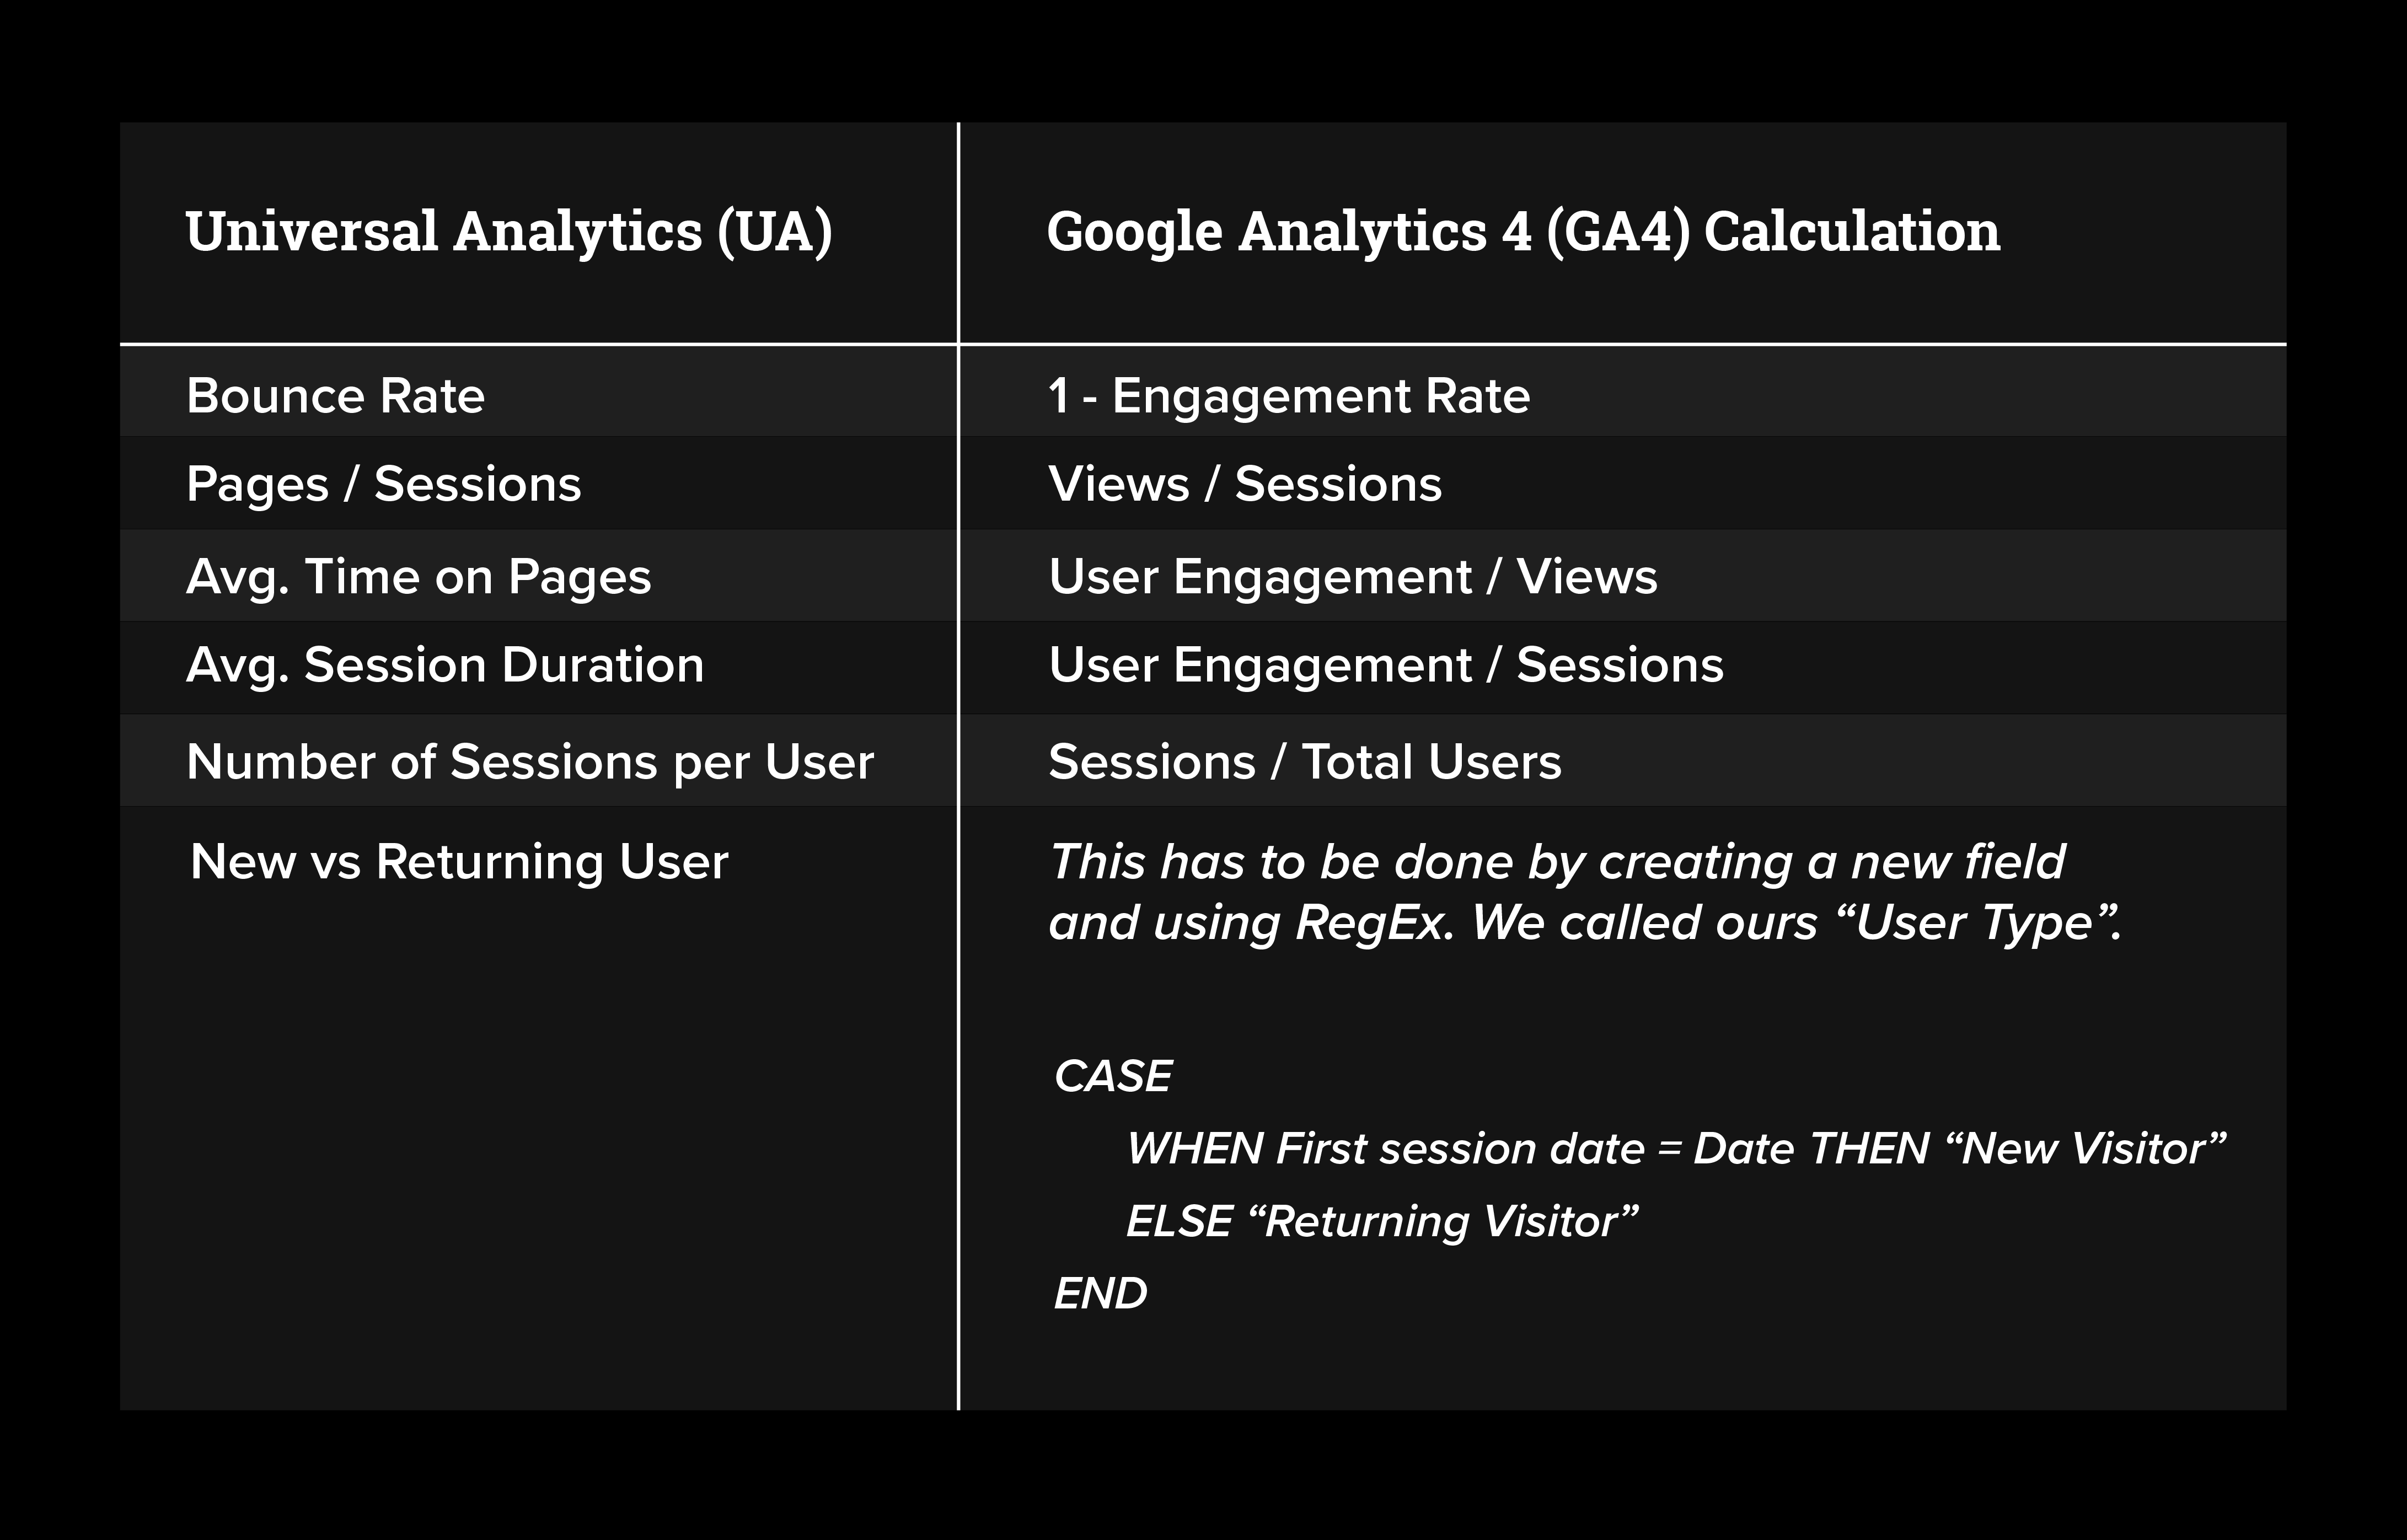
How to set up calculations
- Select your table/chart/graph and your metric or dimension to populate it.
- From here you can create a custom field.
- Name the metric/dimension whatever you’d like.
- Select the correct “Type” for your metric/dimension.
- Add in your new formula!
Goals, Conversions, and Events
Another big change in GA4 is the replacement of Goals with Events and Conversions. Gone are the days when we can select the specific Analytics Goals to populate our Looker Studio dashboards. Now getting that info requires a little more work, and it begins and ends with Events.
Events
With Engagement being a primary focus in GA4, Events are a key part of how Engagement is determined.
When pulling up Events in Looker Studio, all Engagement Events will show (ie. Scroll, Page View, Session Start). If you only want to see certain Events in your visual data, then you’ll need to add filters, either by including or excluding certain Events.
Conversions
Critical KPI events can be selected as a “Conversion” in GA4, which allows these events to show up as a Conversion in the data.
To better understand these metrics for Looker Studio, here’s a breakdown:
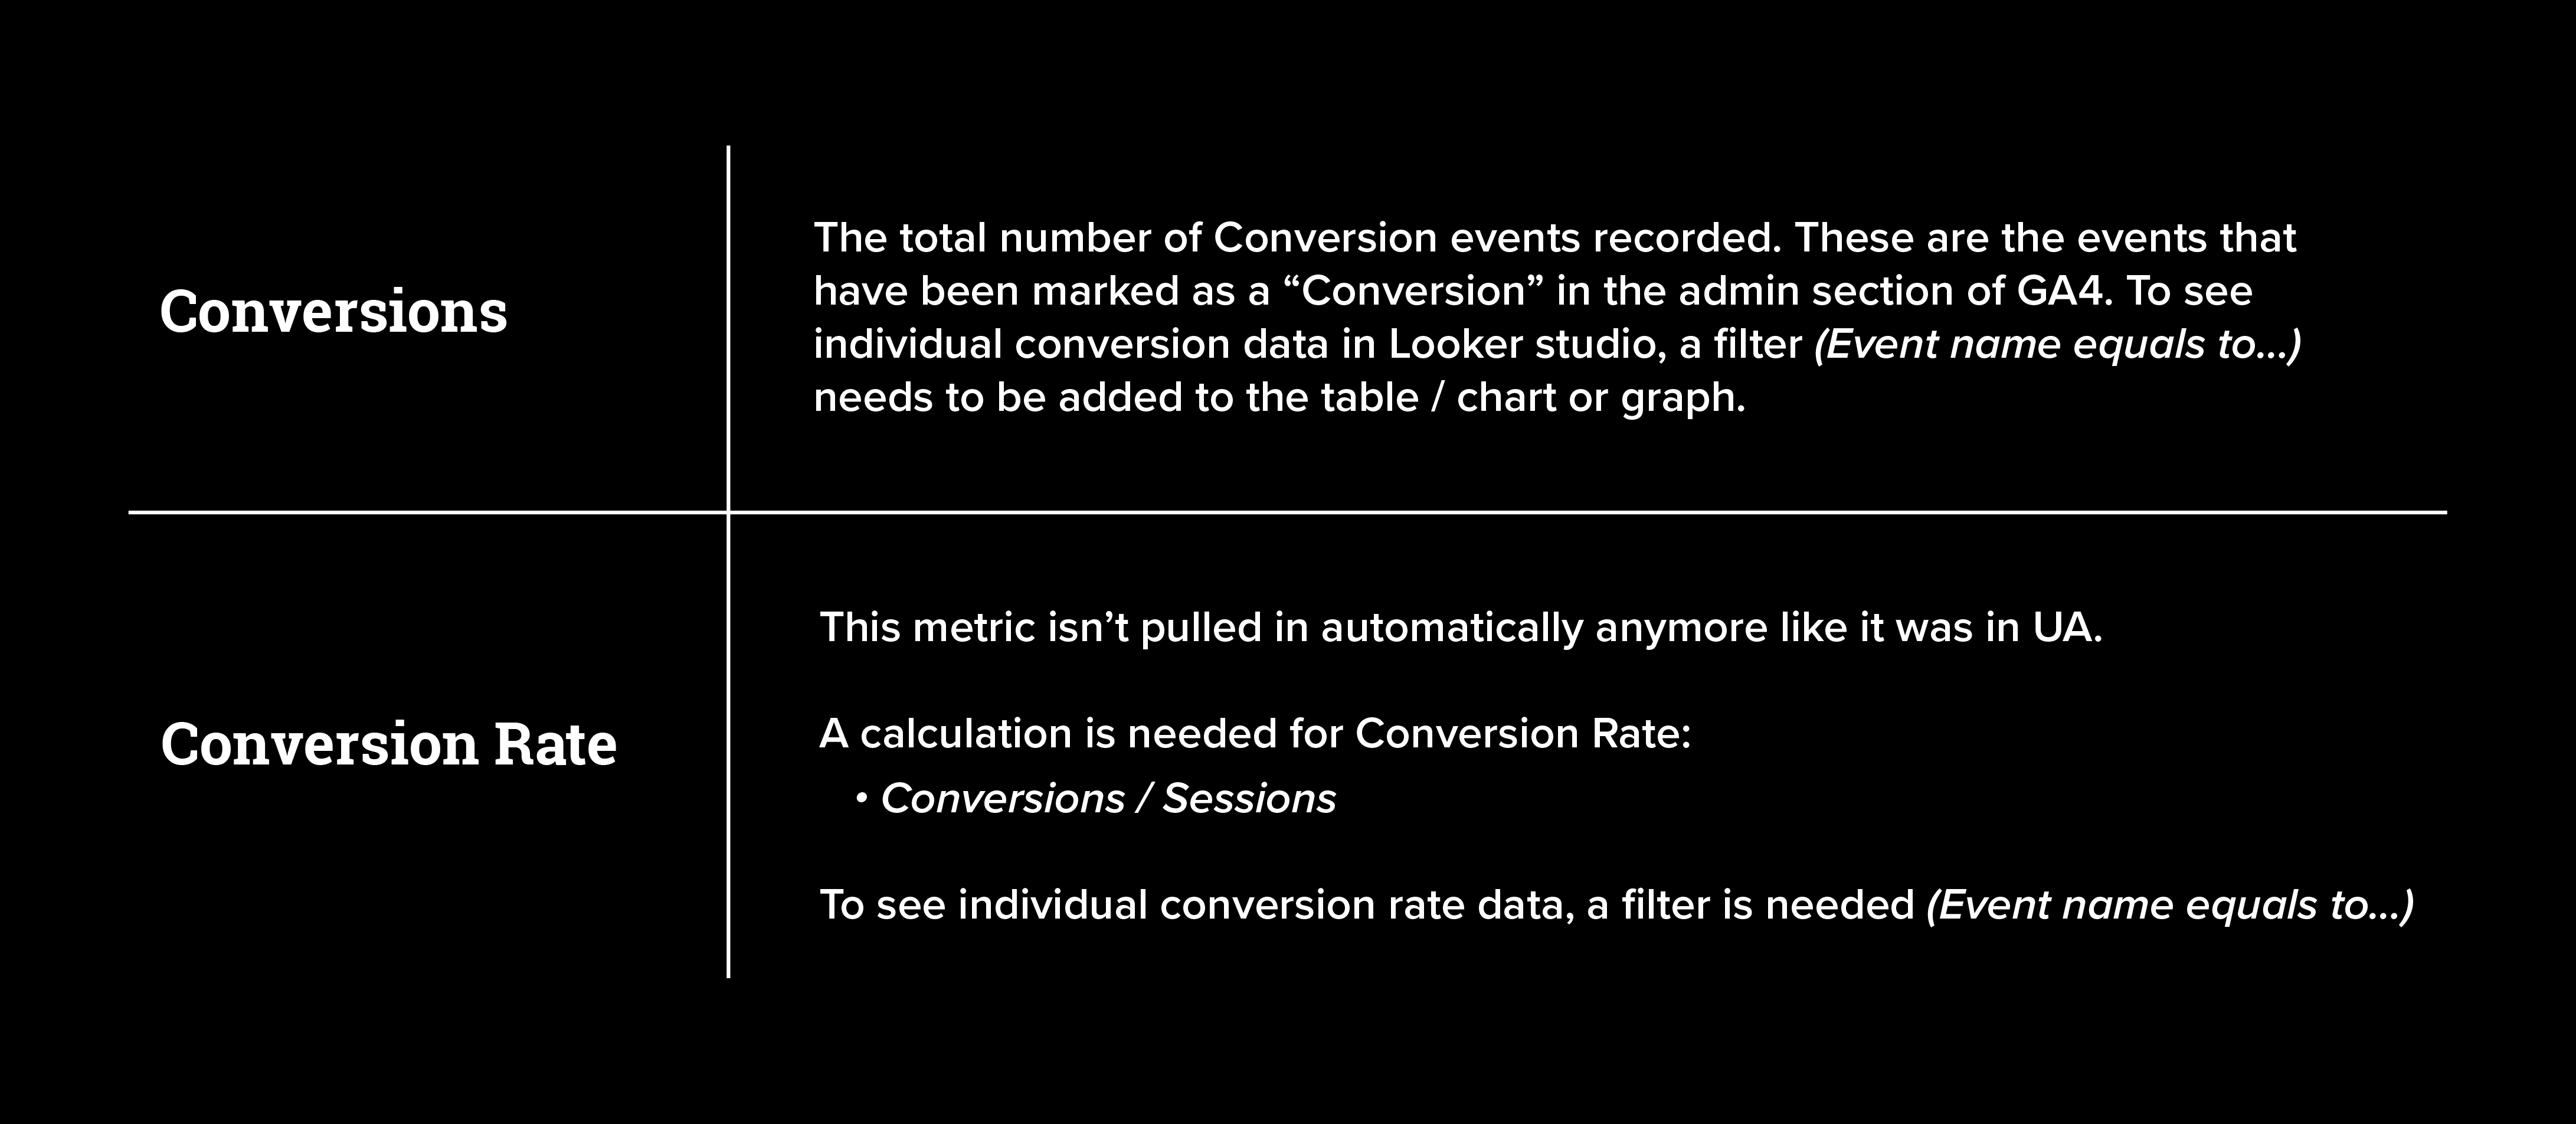
How to see Conversions in Looker Studio
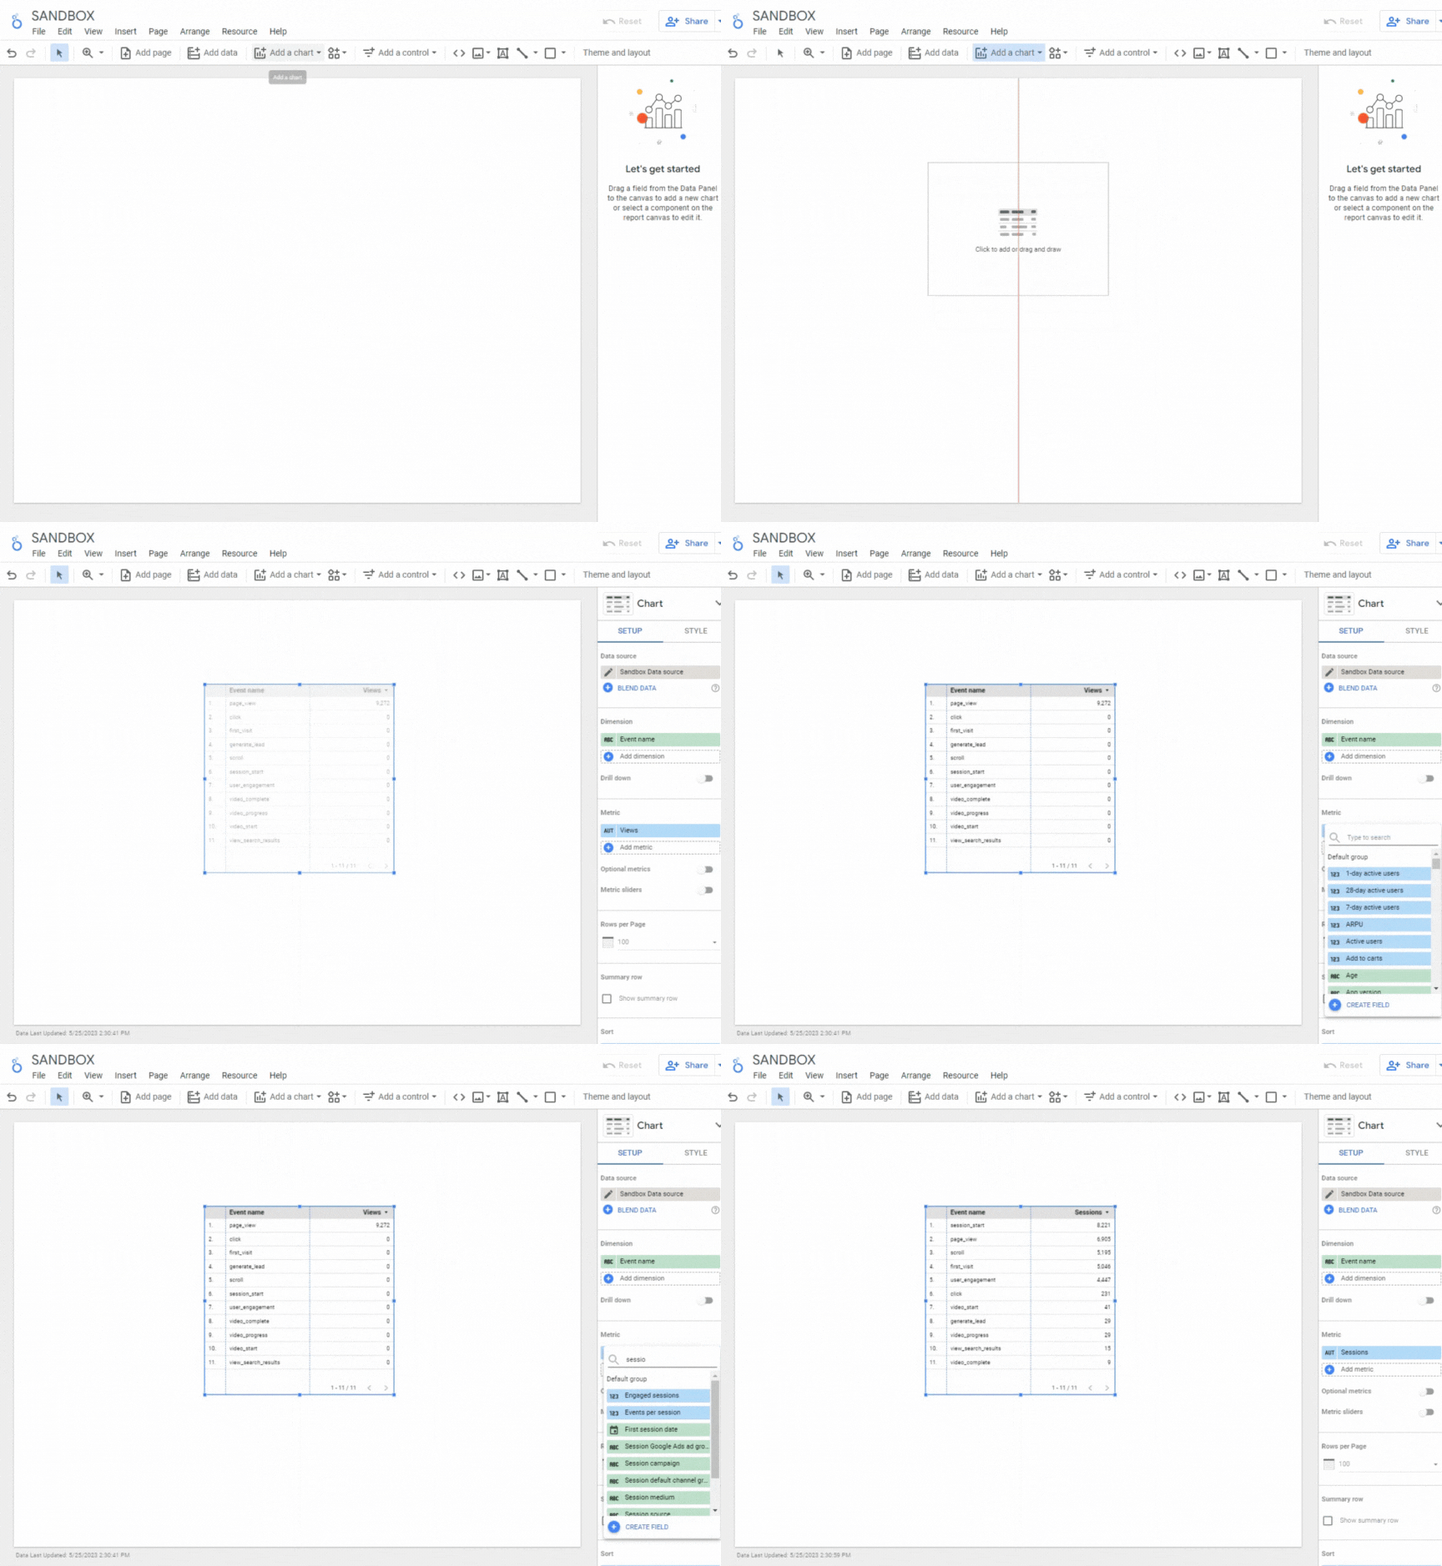
Create a table or graph and select the following:
- Dimension: Event Name
- Metric: Sessions
The default is set to View, but seeing as GA4 is now session-based, Sessions is the way to go for getting your data.
Next, create and apply our filters to single out individual Conversion goals:
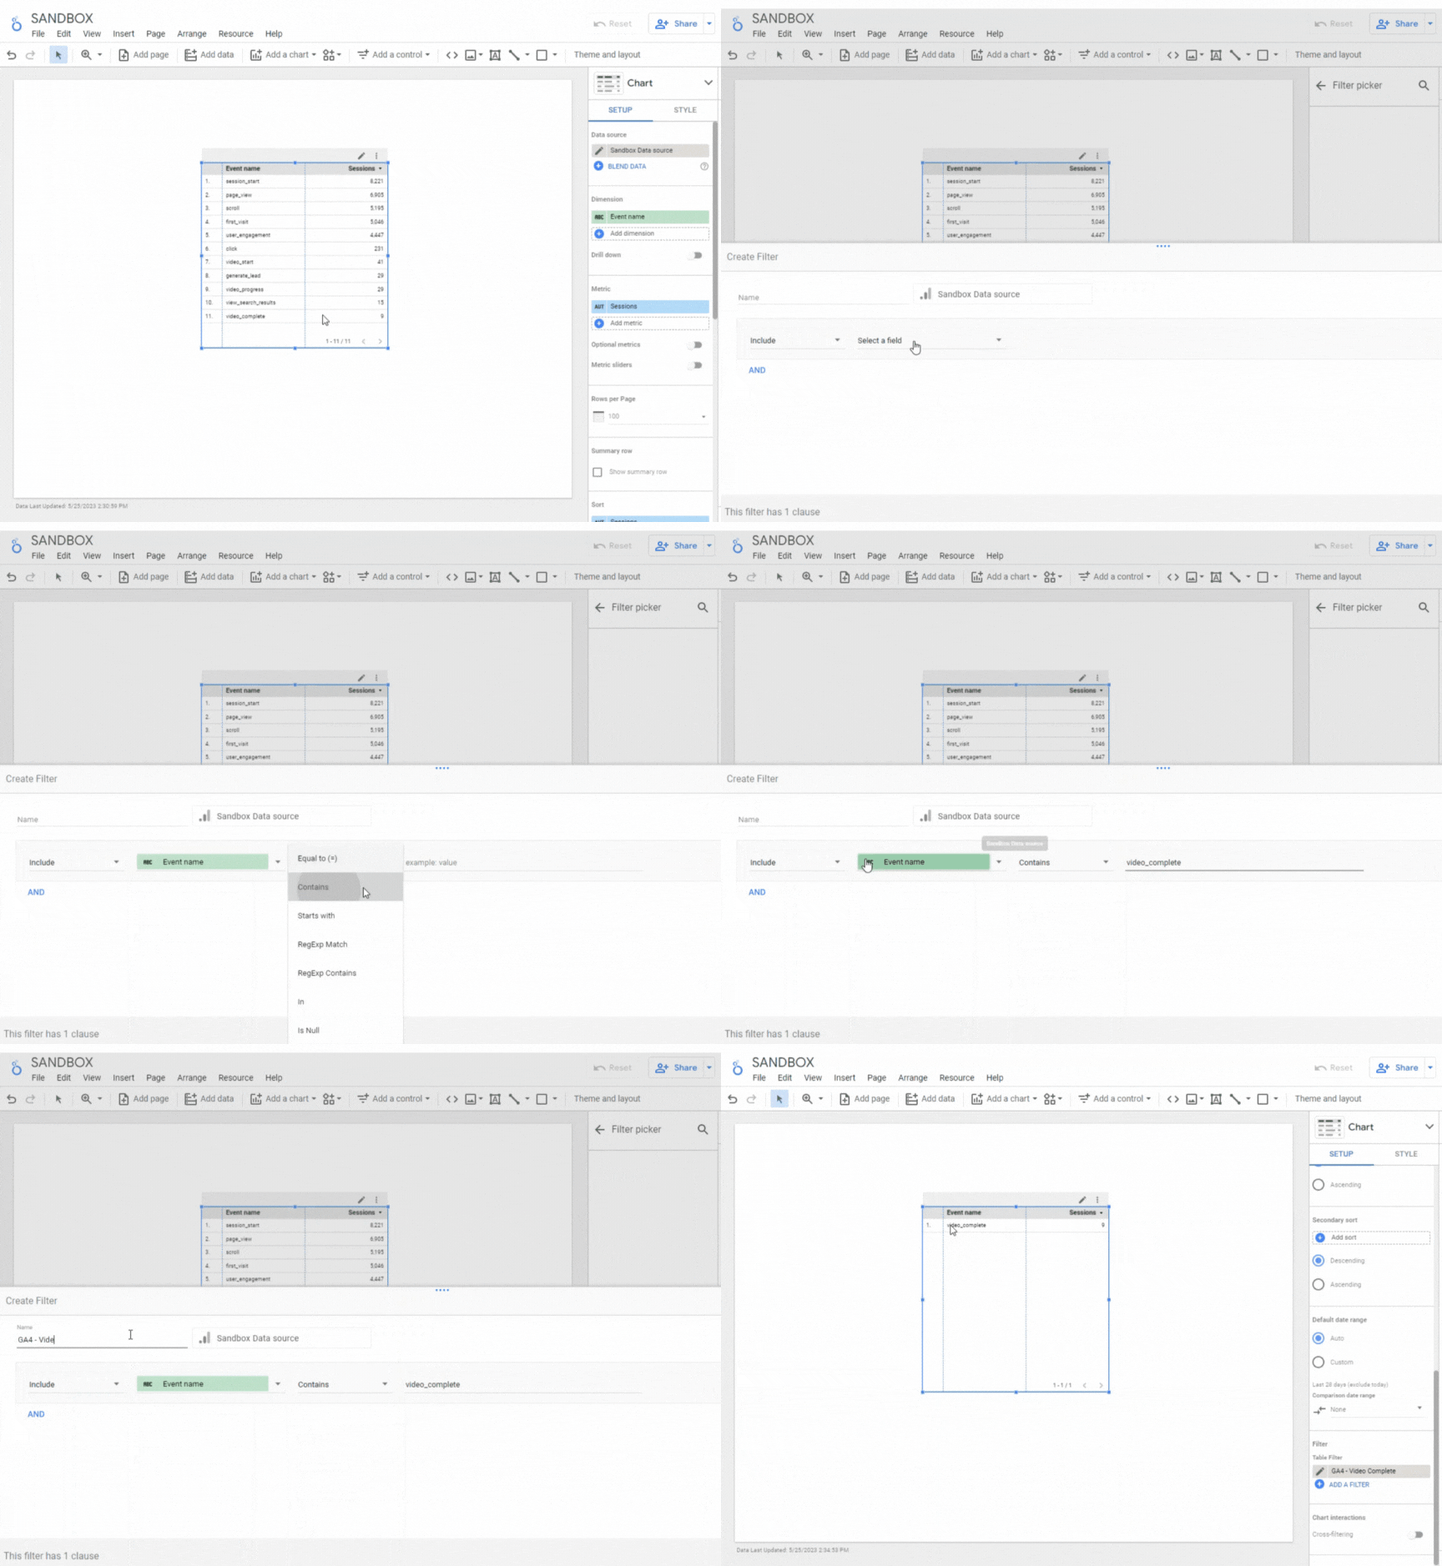
Now, if you want your table or graph to contain more than one conversion, then just add those events to the filter accordingly.
If you want your tables to contain a column for each conversion, then you’ll have to create a separate table for each conversion, then blend them all together into one table.
Making your data easier to read with RegEx
Sometimes when we pull in data into Looker Studio, it’s not visually appealing or it’s difficult to read. This is where Regular Expression (RegEx) comes in handy.
“Wait, Regular Expression???…that seems way too hard and complicated for me!”
RegEx can be difficult to wrap your head around but don’t be afraid. The simplest way to think of it is as a syntax or set of rules/patterns that we specify to manipulate our data. RegEx isn’t a new thing for GA4, we were able to use it with UA reports as well, but since we’re on the topic, why not fully upgrade your Looker Studio reports when you do your migration?
Take this GA4 data table for example. It’s raw and could look more professional. Let’s make the event names title case and remove symbols so we only see letters.
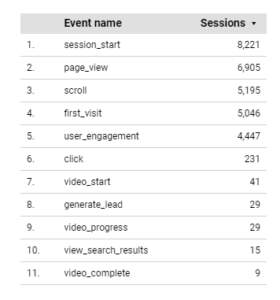
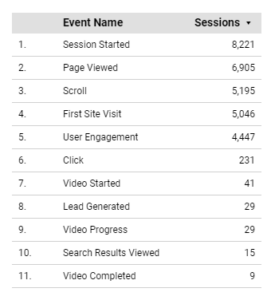
By adding a few Regex instructions, we can make this raw data look presentable for our reports—especially if shareholders, clients, or executives are reading them:
How to use Regex to make reports look visually appealing
The first step when you are using any RegEx in a table/chart/graph is to create a new field. In this case, we wanted to rename the data for the “Event name” dimension, so we created a new field under dimension, and just called it “Event Name”.
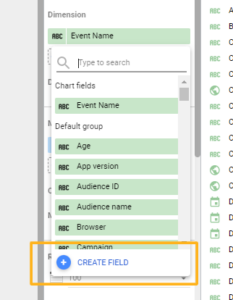
What we essentially want to do with this RegEx is a glorified “Find and Replace”. We’re going to tell our RegEx that when our “Event name” dimension matches a certain text, we want to replace it with a new set of text.
Here is the exact RegEx we used for this data renaming:
CASE
WHEN REGEXP_MATCH(Event name,”session_start”)THEN “Session Started”
WHEN REGEXP_MATCH(Event name,”page_view”)THEN “Page Viewed”
WHEN REGEXP_MATCH(Event name,”scroll”)THEN “Scroll”
WHENREGEXP_MATCH(Event name,”first_visit”) THEN “First Site Visit”
WHEN REGEXP_MATCH(Event name,”user_engagement”) THEN “User Engagement”
WHEN REGEXP_MATCH(Event name,”click”)THEN “Click”
WHEN REGEXP_MATCH(Event name,”video_start”) THEN “Video Started”
WHEN REGEXP_MATCH(Event name,”generate_lead”) THEN “Lead Generated”
WHEN REGEXP_MATCH(Event name,”video_progress”)THEN “Video Progress”
WHEN REGEXP_MATCH(Event name,”view_search_results”)THEN “Search Results Viewed”
WHEN REGEXP_MATCH(Event name,”video_complete”)THEN “Video Completed”
ELSE Event name
END
When you add your own RegEx, you can customize the text to say whatever you want. Just copy this code and tweak it for your own use.
QA for discrepancies in your GA4 migration
As you start migrating your Looker Studio dashboards over to GA4, you might notice some discrepancies in the data when comparing your UA data to GA4 data. This is due to the new data model with everything now focusing on Events, Engagement and Sessions.
If the data discrepancies are really large, check whether there was an error in the migration (ie. wrong metric/dimension selected). So make sure to check those discrepancies!
Embrace change, keep on tracking and rock n’ roll
No doubt, GA4 has stirred the pot for marketers over the last year. For marketers, the learning never stops. You’ve ventured into new channels, tackled new tools, and faced jabs of trends and fads before. You can take on GA4 and Looker, too.
Go get ’em, champ! 🥊
https://www.youtube.com/watch?v=ERT_7u5L0dc


