A marketer’s guide to 2022 social media statistics
By: Kyle Weber
February 4, 2022 | Reading Time: 9 mins
2021 was a big year for social media and digital experiences in general. As a big spoiler-alert to future plans, Facebook changed its name to Meta. Instagram hit 2 billion users, Twitter went through a messy breakup, and Snapchat continued to do whatever Snapchat does (sorry, I’m not thirteen). All the while, your favourite dance instructor became the internet’s most viewed website in 2021.
It’s a new year and that means a new batch of stats on social media users, engagement, and more. If you want to see how far your favourite social platforms have come, check out our 2021 and 2020 entries.
Here are the 2022 social media statistics and demographics that marketers need to know.
While I think Facebook’s UX gets worse with every added feature, its marketing statistics still paint it as the best option for social media marketing. With its 2.1 billion user ad reach and a reasonable cost per click—especially for video ads—Facebook reportedly provides the highest return on investment among all paid advertising channels. Now, forgive me for not taking those stats at face value. Consider me one of the 75% of people who don’t trust Facebook. Quietly, Facebook has been fighting claims that it inflated ad metrics to boost revenue. Sure, being on CNBC is hardly quiet, but compared to the 2021 ad boycott and this laundry list of scandals, this one seems a little under the radar.
But as soon as you start doubting Facebook, an article drops about its ability to advertise to a single specific person and you get sucked back in. I can’t quit you, Facebook!
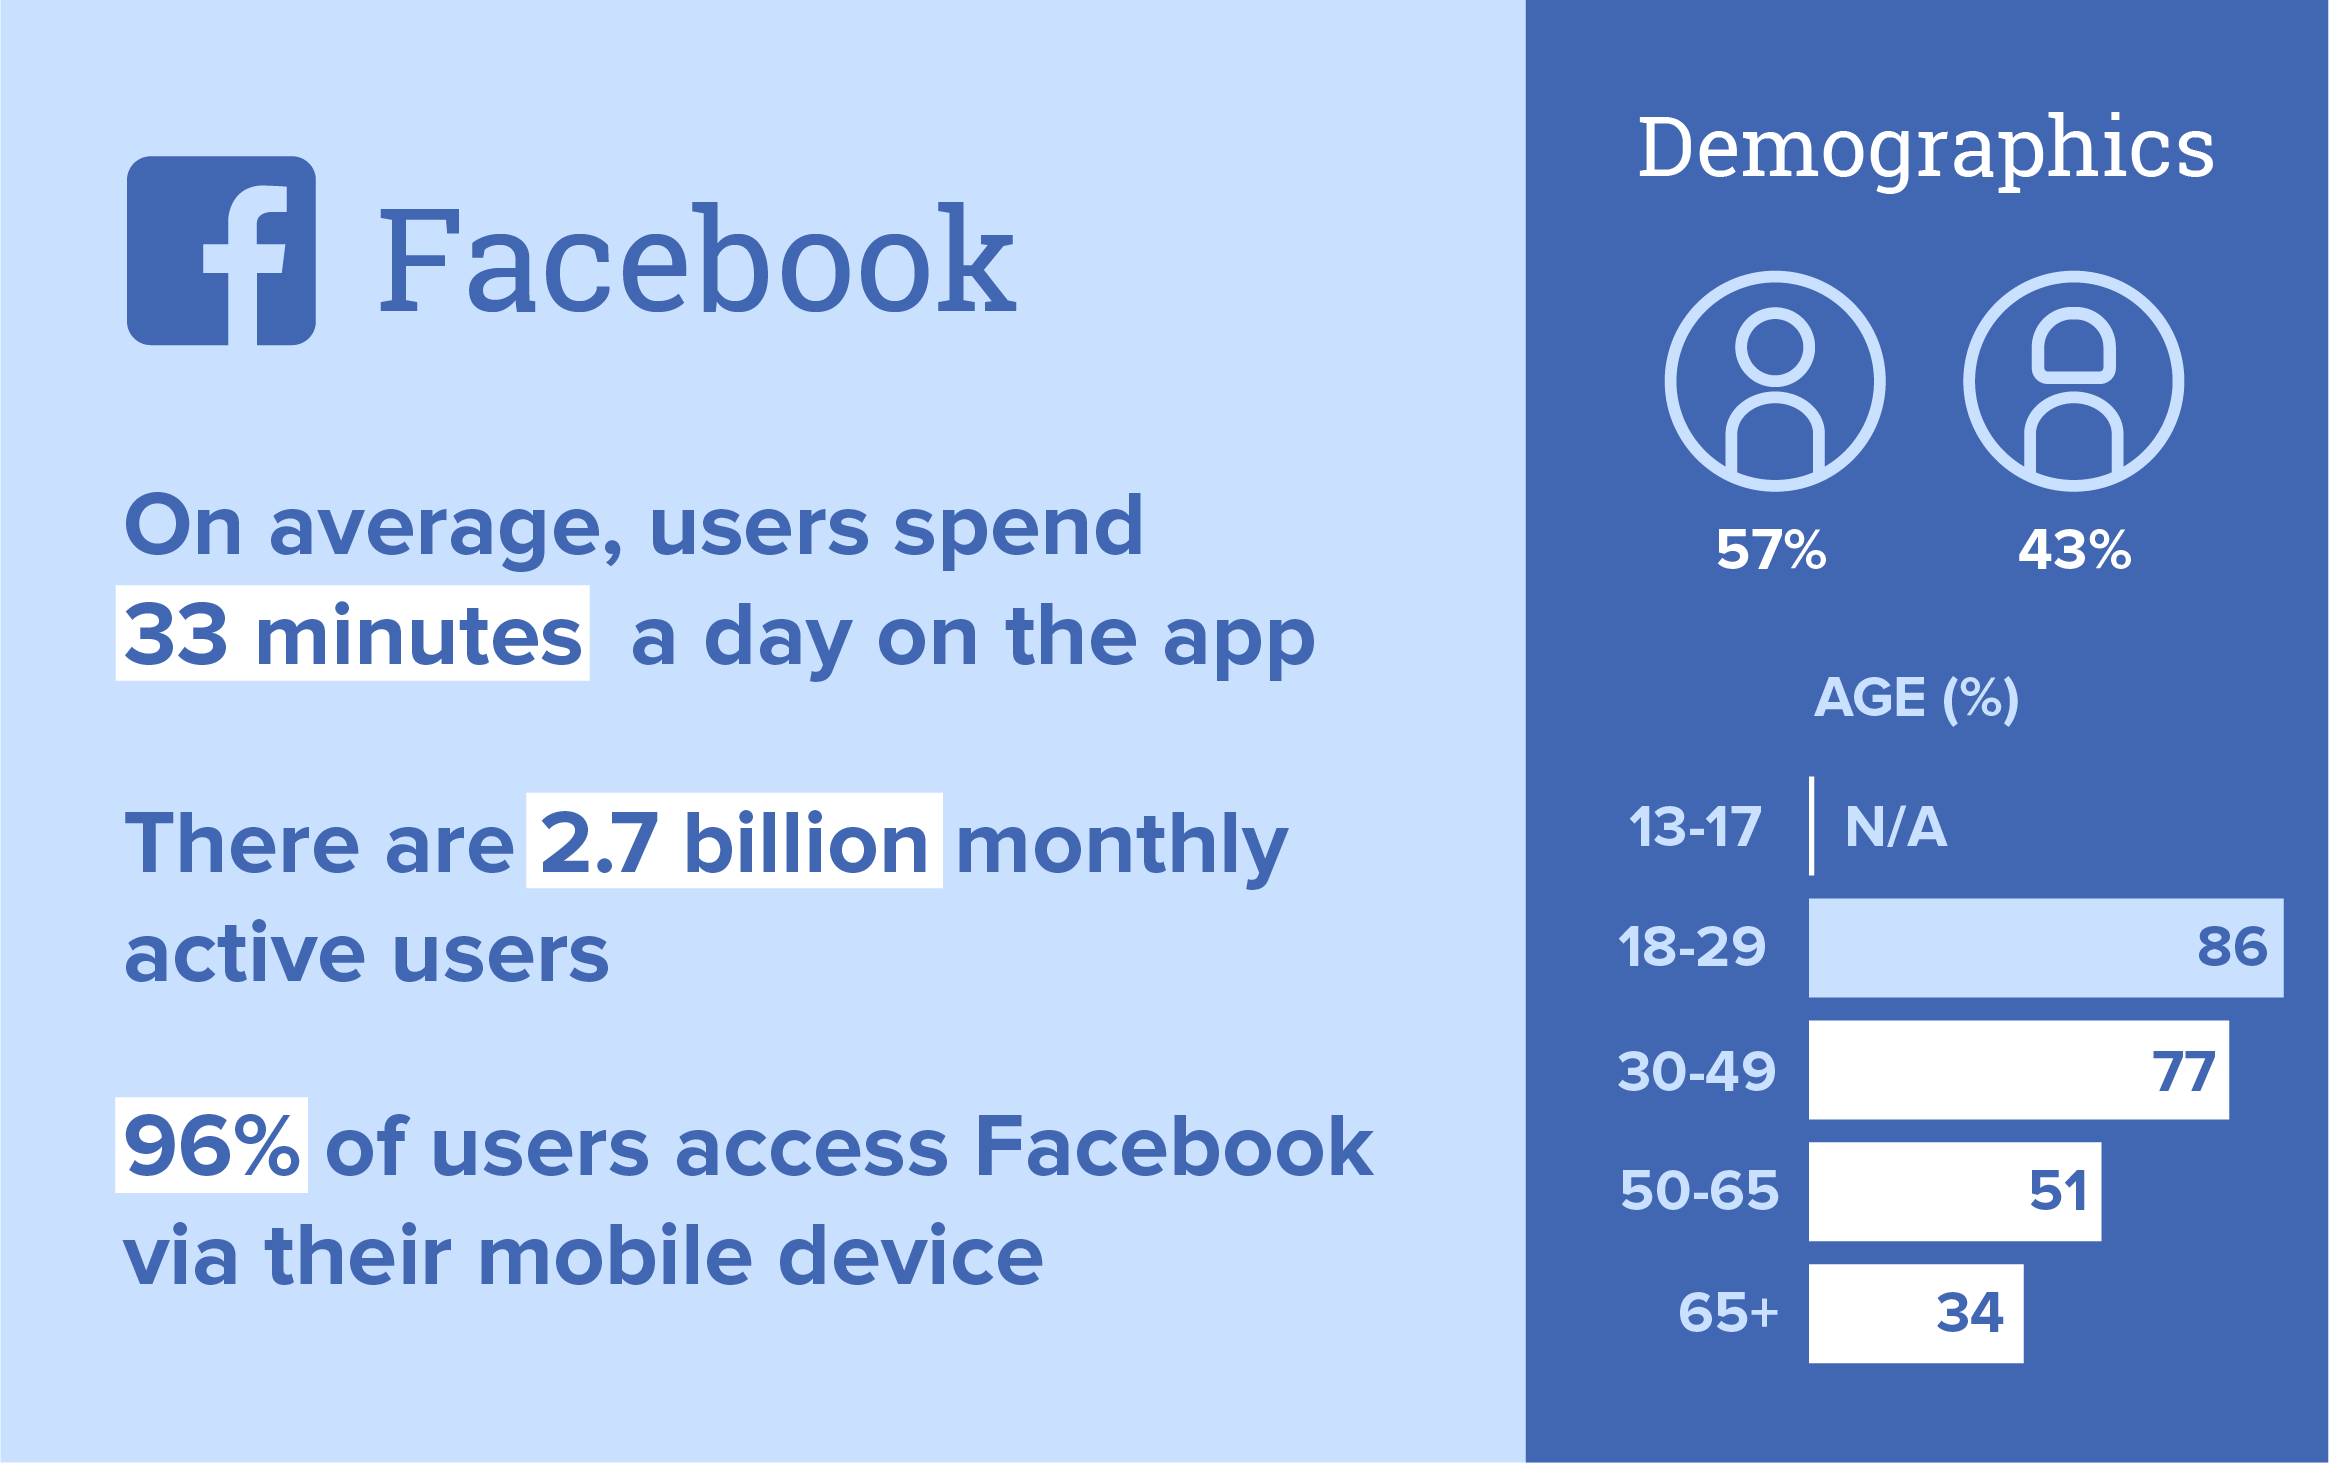
So where does that leave us? With 1.9 billion daily active users and the average American user spending 33 minutes on Facebook each day, Facebook should continue to have a place in your marketing toolbox whether you’re a fan or not.
In terms of everything that is Meta, we’re keeping our eyes on the road to the Metaverse. We’re excited to get there, but a run of failed events and articles suggest it might be a long drive.
Here are some more 2022 Facebook stats for marketers:
- Facebook has 90 million users in the US.
- Facebook’s largest age group is 25-34-year-olds.
- Users spend 19.5 hours per month on the platform.
- 96% of users access Facebook via mobile devices.
- 78% of consumers follow brands on Facebook.
TikTok
TikTok went full Lindsay Lohan in Mean Girls. It started out as the quirky new kid at school before vaulting to the top of the social ladder in what felt like an hour and thirty-seven minutes. TikTok’s rise wasn’t without its bumps, though, and as that rise continues, experts predict things will only get bumpier. Heavy is the head that wears the Spring Fling crown, of course.
Supposedly gaining 8 users every second, TikTok is already having a hard time scaling content moderation. As we’ve seen with Facebook, losing track of what content is posted on your platform can leave you vulnerable to scandal. When your own content moderators are suing you over what they’ve seen, you know it’s bad.
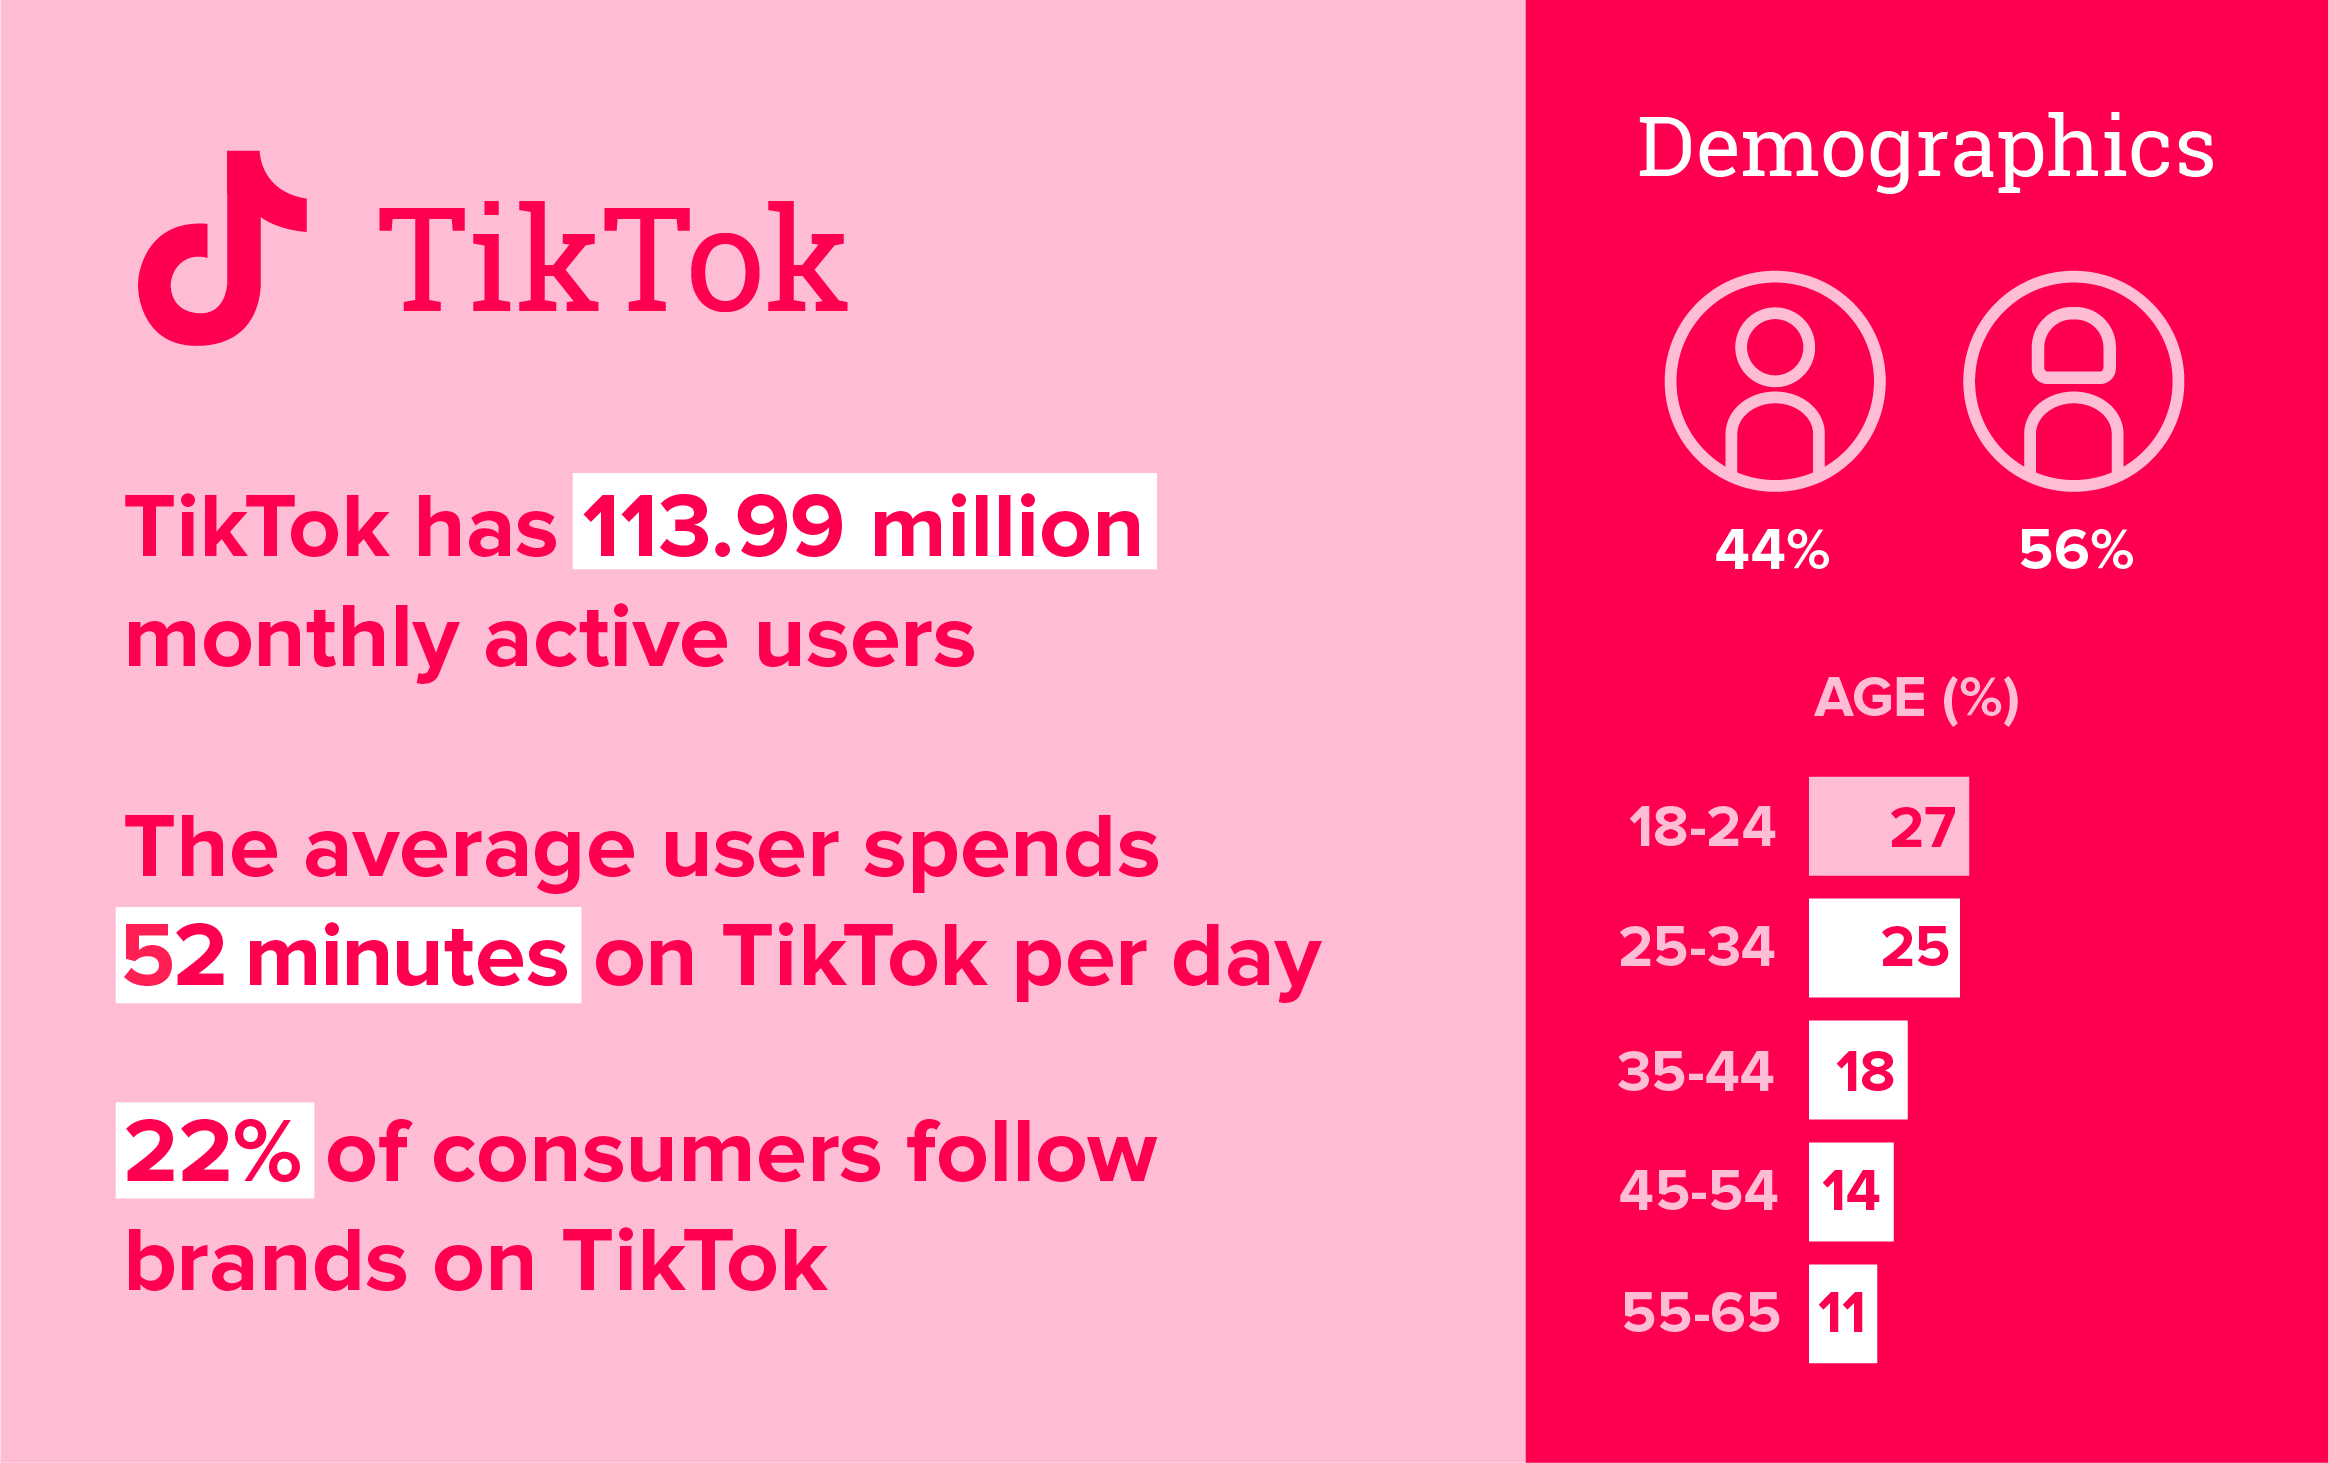
But this should be looked at in a “more money, more problems” sort of way. These scandals are the byproduct of a massive audience and unreal engagement. Marketers should look at how businesses have leveraged TikTok so far and consider whether these strategies could be translated to their own brands and clients. Truthfully, it’s not for everyone. But with TikTok users clocking 52 minutes on the app daily, that could change fast.
Here are some more 2022 TikTok stats for marketers:
- 65.9 million of its users are in the US.
- TikTok’s largest age demographic is 18-24-year-olds.
- 25% of TikTok users are under 19 years old.
- 22% of TikTok users follow a brand.
- TikTok partnered with Shopify in August 2021, signalling an investment in platform shopping capabilities.
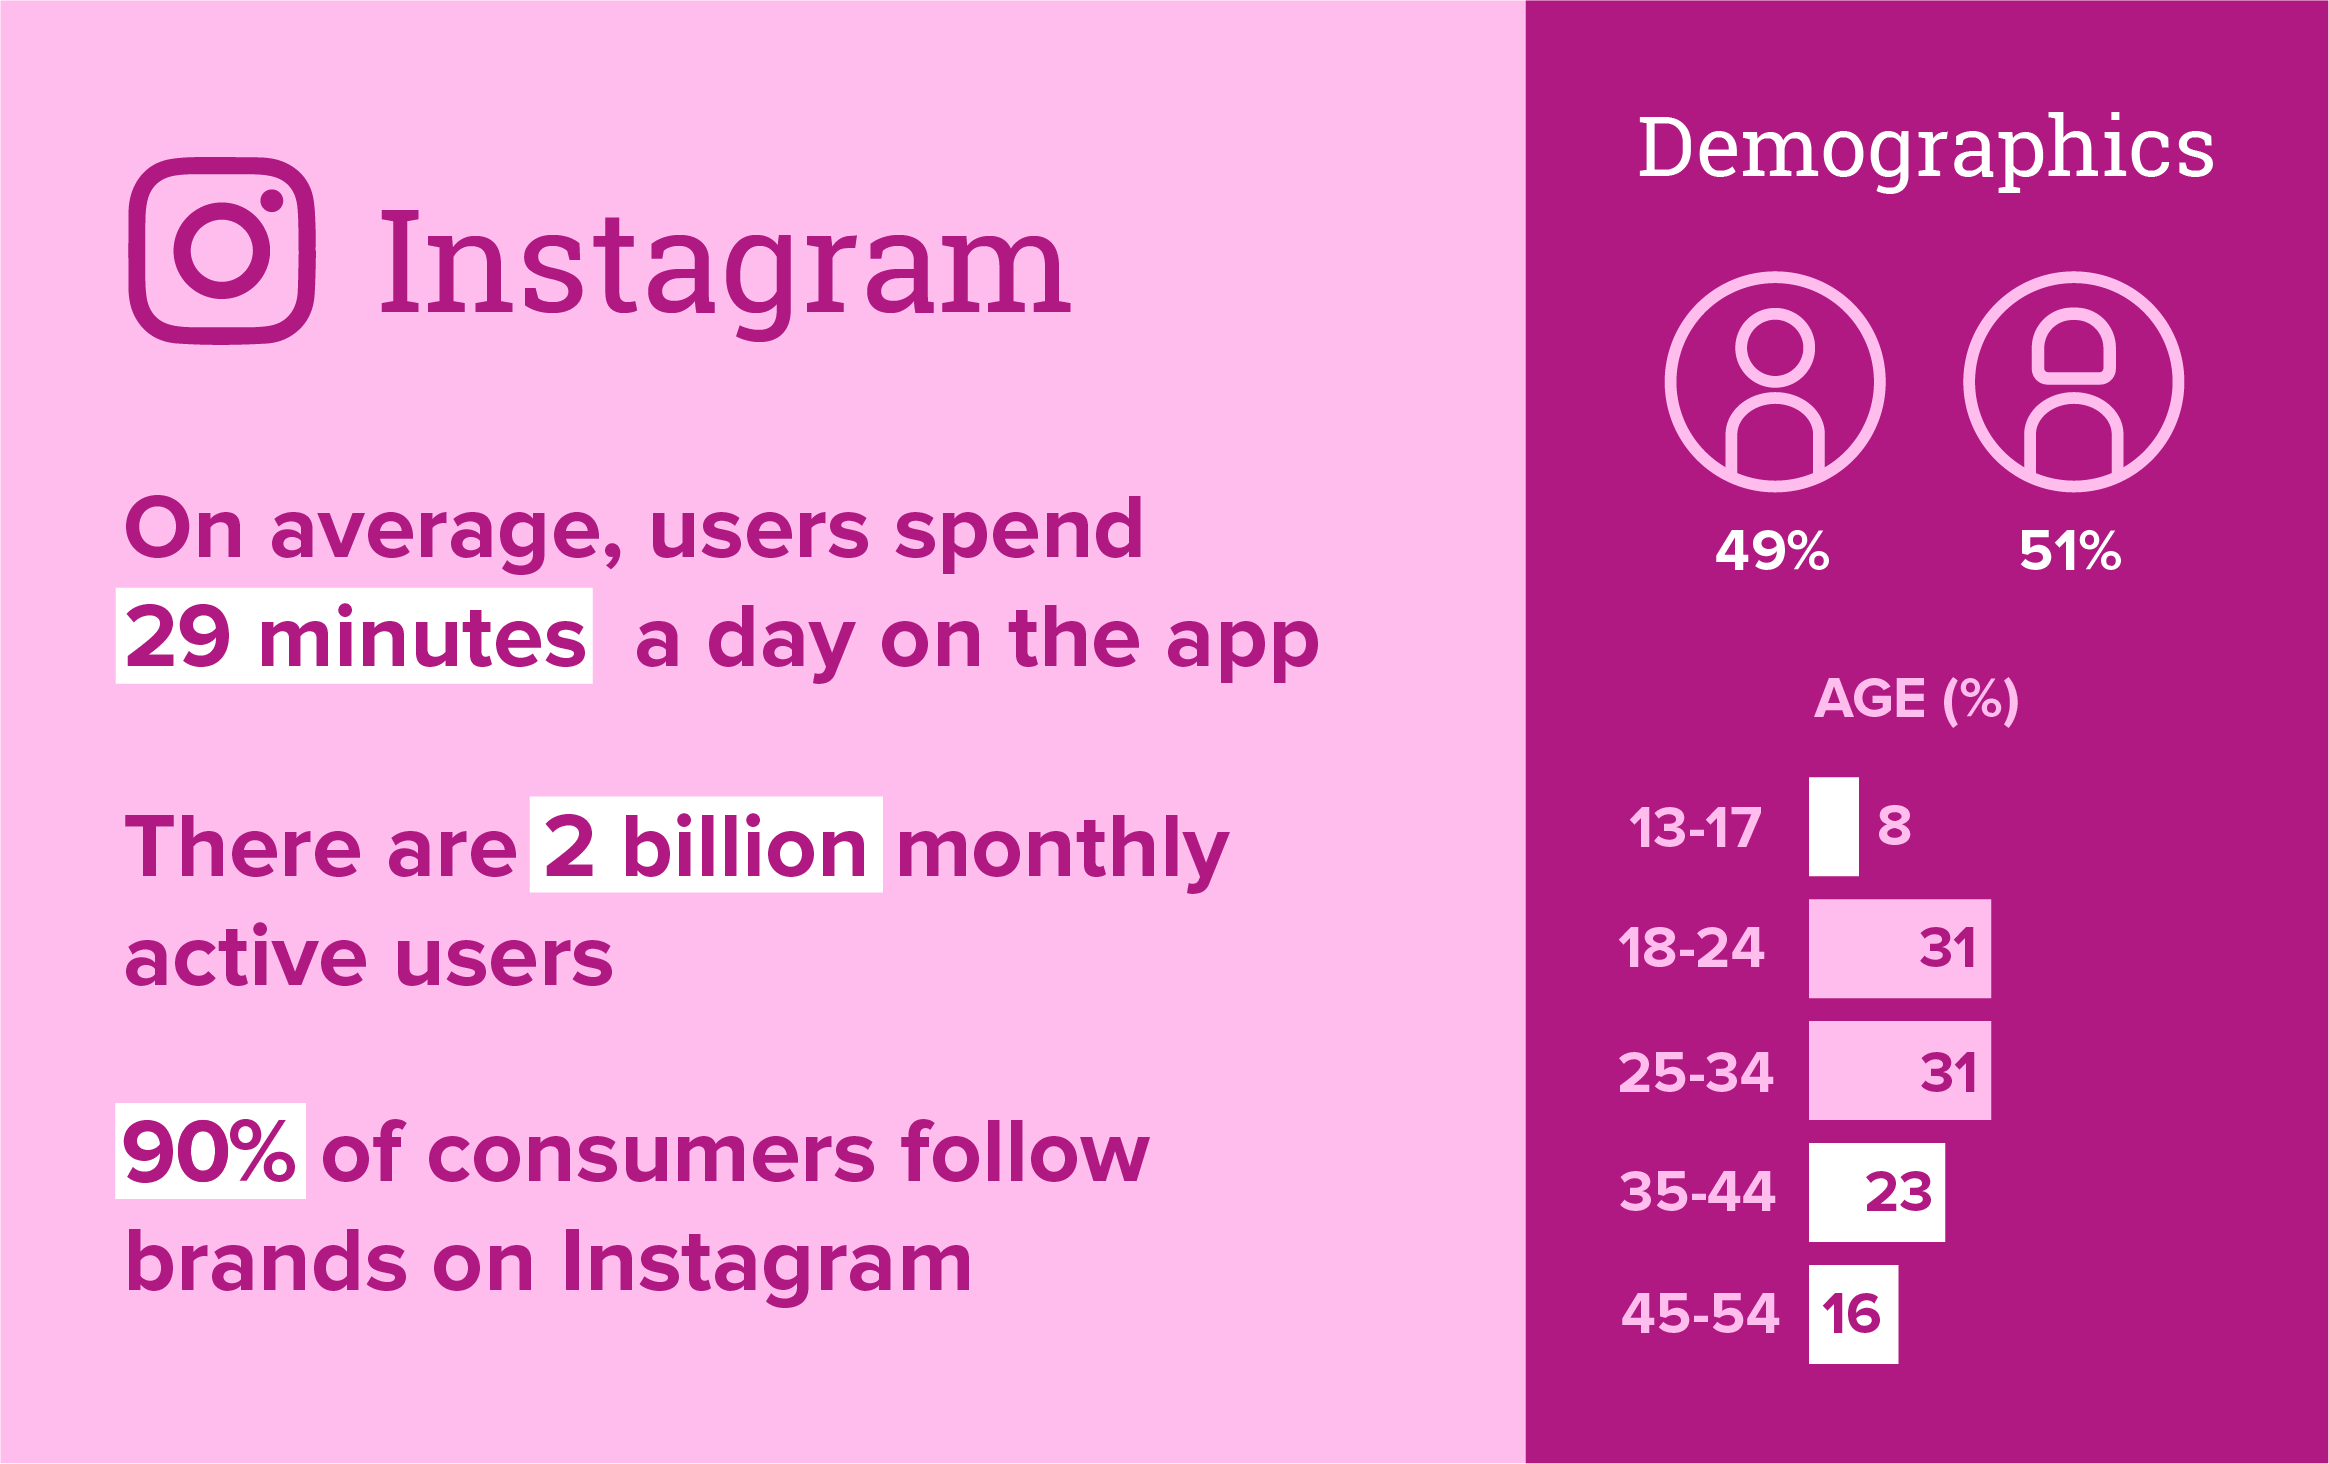
Just before the end of 2021, Instagram hit the milestone of 2 billion monthly active users, giving it the largest audience on this list outside of Facebook and Youtube. That audience is split evenly between men and women with the majority of them being between the ages of 18 and 34. Engagement is high, with the average user spending 29 minutes on the app each day—but what are those users actually doing?
A lot of the time, they’re shopping. Instagram claims that 130 million users click the “Shop” button each day, which is where the platform has really developed over the years. It’s stayed competitive with other platforms by adopting things like Stories and Reels, but where Instagram sets itself apart is in the eCommerce space. Recently rolling out an Affiliate program to incentivize creators to sell products on the platform, brands should look to transforming their Instagram profiles into online stores—especially when considering that 58% of users claim to be more interested in a brand after watching their IG stories.
With that, 90% of Instagram users say they follow at least one business account and 44% say they shop on Instagram each week. Of course, these stats apply mainly to B2C brands. As we’ve seen, B2B brands have typically used Instagram to share bite-sized insights that show their capabilities and give glimpses into their culture.
Here are some more 2022 Instagram stats for marketers:
- Instagram has 140 million users in the US.
- Users spend an average of 10.3 hours a month on Instagram (get a life, people).
- The largest demographic on Instagram is men between 18 and 24 years old, but the gender split overall is quite even.
- 57% of Instagram users follow brands.
- 60% of American Gen-Zer’s use Instagram to discover new brands and products.
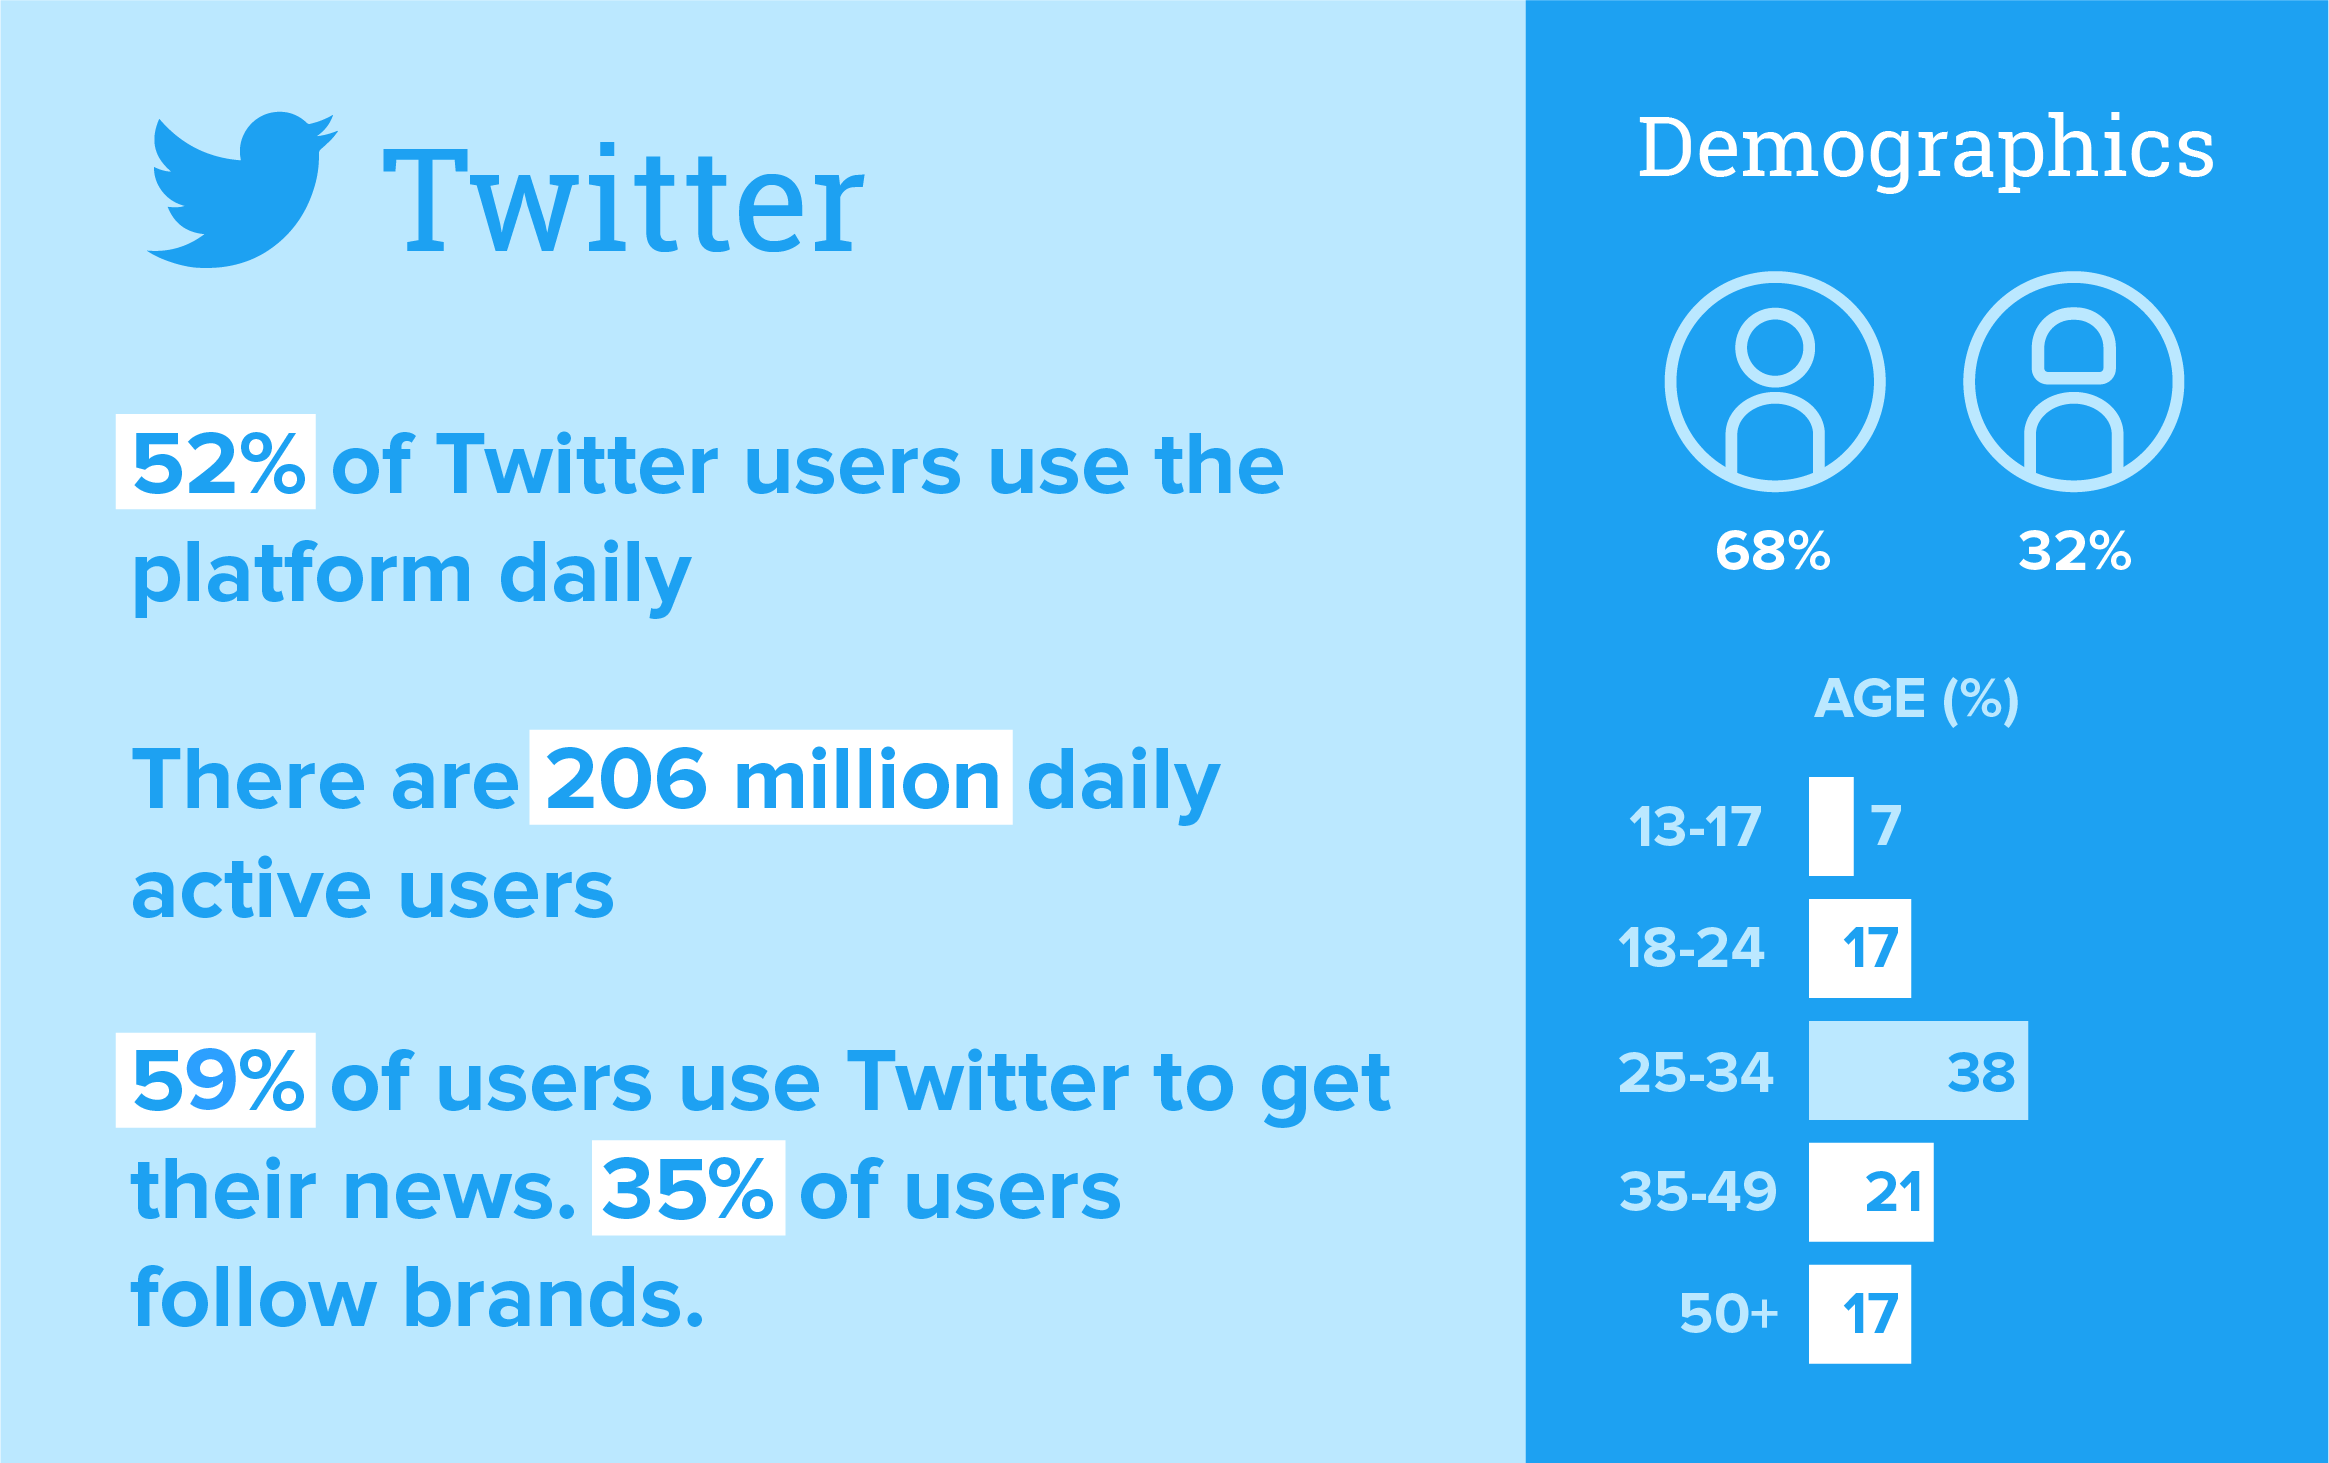
You might be surprised to know that aside from Pinterest, Twitter has the fewest users of all the platforms on this list. Despite this, with 206 million daily active users and some great targeting capabilities, I’m a big fan of Twitter for B2B marketing—as are 82% of B2B content marketers using Twitter for organic marketing.
I like Twitter because of how users engage with the platform. 59% use Twitter to stay up to date with the news and 35% of Twitter users follow brands. Instead of people sharing photos of their kids, you get people sharing their thoughts on interests, events, politics, and oftentimes the industry they work in. Users are more likely to follow accounts than they are on Facebook and it’s more built around users’ interests rather than their personal social networks. Together, these features make Follower-Lookalikes and Interest targeting a bit more pointed.
It appears I might be in the minority of B2B marketers who feel that way, though, with just 27% of marketers are using paid Twitter ads. Maybe they’re not looking to market to predominantly affluent millennial men? Or maybe they’re worried about advertising to the 500 million people who use Twitter each month without actually logging in? Both are valid, but this lack of paid ad congestion helps to relieve competition and drive down the cost of advertising, making Twitter the most affordable social ad platform and definitely worth taking a swing.
Here are some more 2022 Twitter stats for marketers:
- The average Twitter user spends 5.6 hours per month on the platform.
- The average American Twitter user spends 31 minutes on the platform each day.
- Tweets with videos generate 10x more engagement than tweets without videos.
- More than 40% of Twitter users have a college or university degree.
- 77% of Twitter users have a better impression of a brand when they respond to tweets.
Going from the least expensive social ad platform to the most expensive, when it comes to B2B marketing, LinkedIn knows what it has to offer and charges for it. Having last reported a user base of 40 million decision-makers and 61 million high-level influencers, there’s a reason why 94% of B2B marketers use LinkedIn for content marketing.
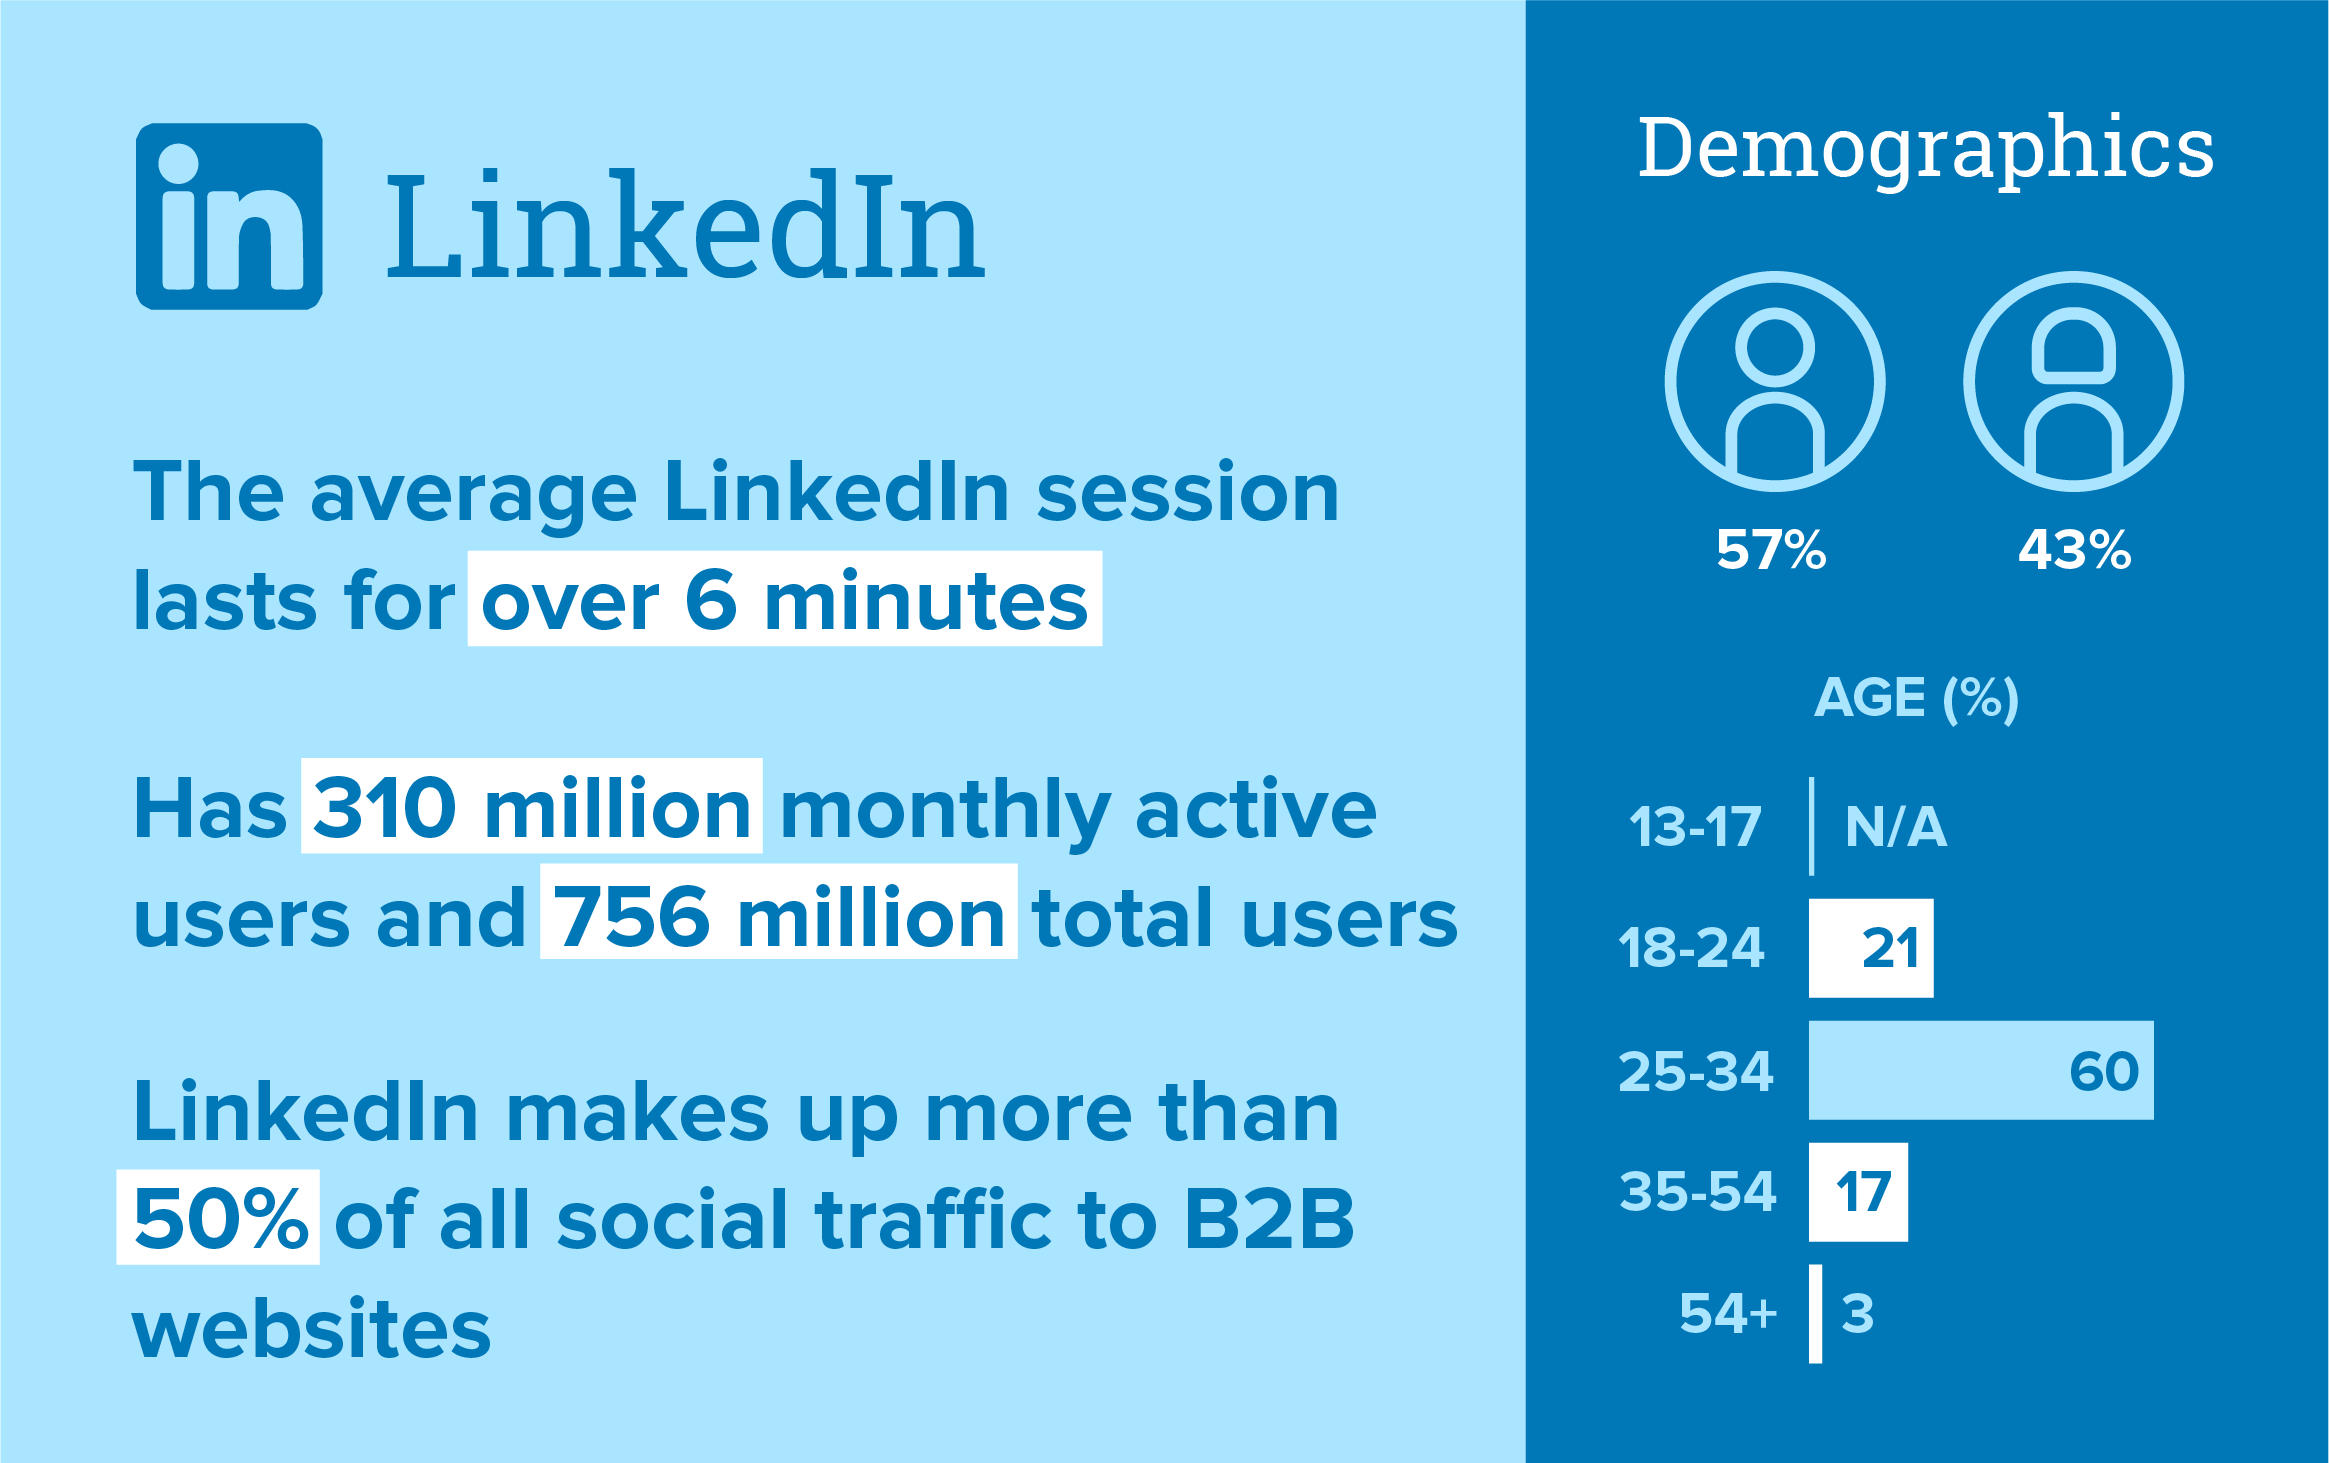
Despite having 310 million monthly active users, only 3 million of them share content each week—meaning there is still plenty of space to establish yourself as a creator. Considering 45% of those who read LinkedIn articles occupy high-level positions in companies, marketers would be wise to ramp up their publishing. While LinkedIn content isn’t at the same volume as Facebook or Instagram, results show its effectiveness, with LinkedIn being responsible for over 50% of all social traffic landing on B2B blogs and websites.
Yes, the average LinkedIn ad click will cost you around $5.26, but statistics show marketers can still make an impact with free organic LinkedIn posts and articles.
Here are some more 2022 LinkedIn stats for marketers:
- About 21% of LinkedIn users are in the US.
- Roughly 60% of LinkedIn users are between 25 and 34 years old.
- Only 16% of LinkedIn users follow a brand page.
- LinkedIn invested $25 million in its Creator Accelerator Program in 2021 to drive content production.
- 57% of LinkedIn traffic is via mobile devices—that’s low compared to most platforms and suggests high desktop usage.
YouTube
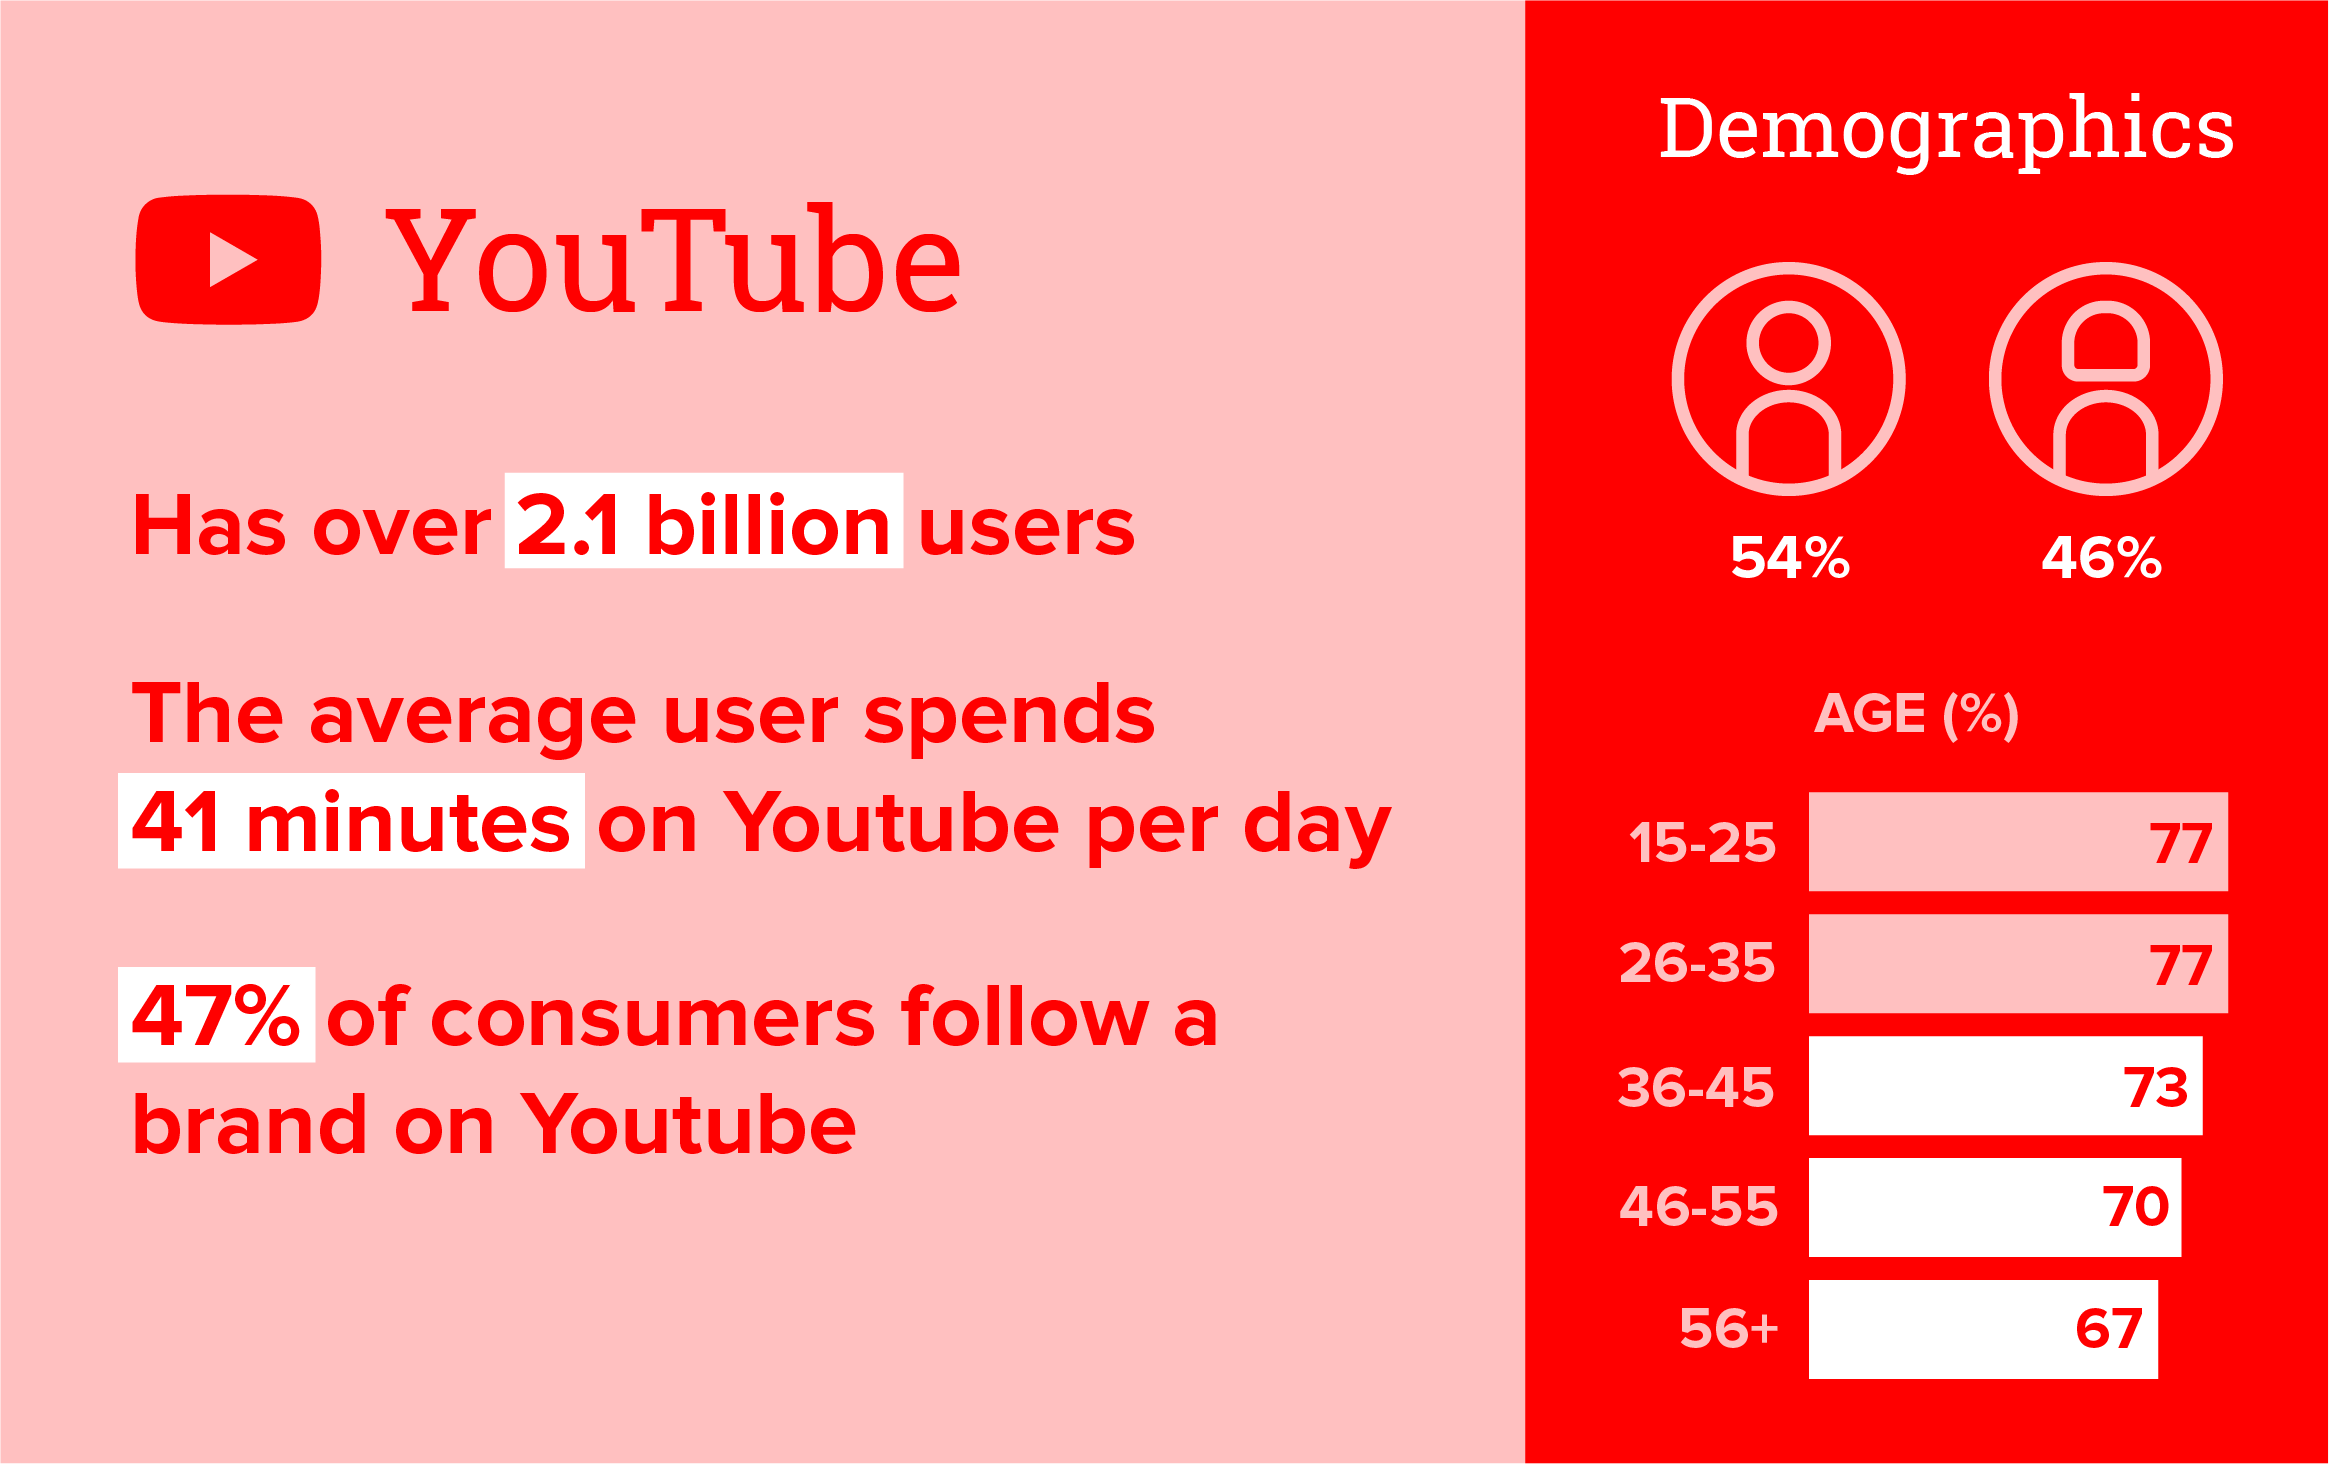
We don’t usually include YouTube in our annual social media statistics blog, but with video now finding its way into the marketing plans of 88% of businesses, we had to. People spend almost 18 hours more time on YouTube than Netflix each month. They spend more minutes on YouTube than Facebook each day. YouTube hits all age groups and is a great place for B2C and B2B brands. So why aren’t 100% of marketers utilizing it for their clients and brands?
23% of those marketers say it’s because they don’t have the time. 17% say video production is too expensive. Evidently, they haven’t heard 88% of marketers are happy with the ROI of their video ads, claiming to generate 66% more qualified leads per year. But that’s video in general—what about YouTube specifically?
A few years ago, our friends at Improvado did a head-to-head between YouTube and Facebook to see which platform was more effective for marketing videos. Ultimately, they found videos perform better on YouTube while video clips (anything under 40 seconds) were better suited for Facebook.
But why choose? The best way to get the most out of your video content is by publishing long videos to Youtube, then cutting them up into smaller clips for other social media platforms.
Here are some more 2022 Youtube stats for marketers:
- YouTube’s largest age demographic is 15-25-year-olds.
- 47% of consumers engage with brands on YouTube.
- More than 500 hours of videos are uploaded to Youtube every minute.
- Users are twice as likely to buy something if they’ve seen it on YouTube.
- 53% of people say watching a live stream helped them feel more connected to other people.
Snapchat
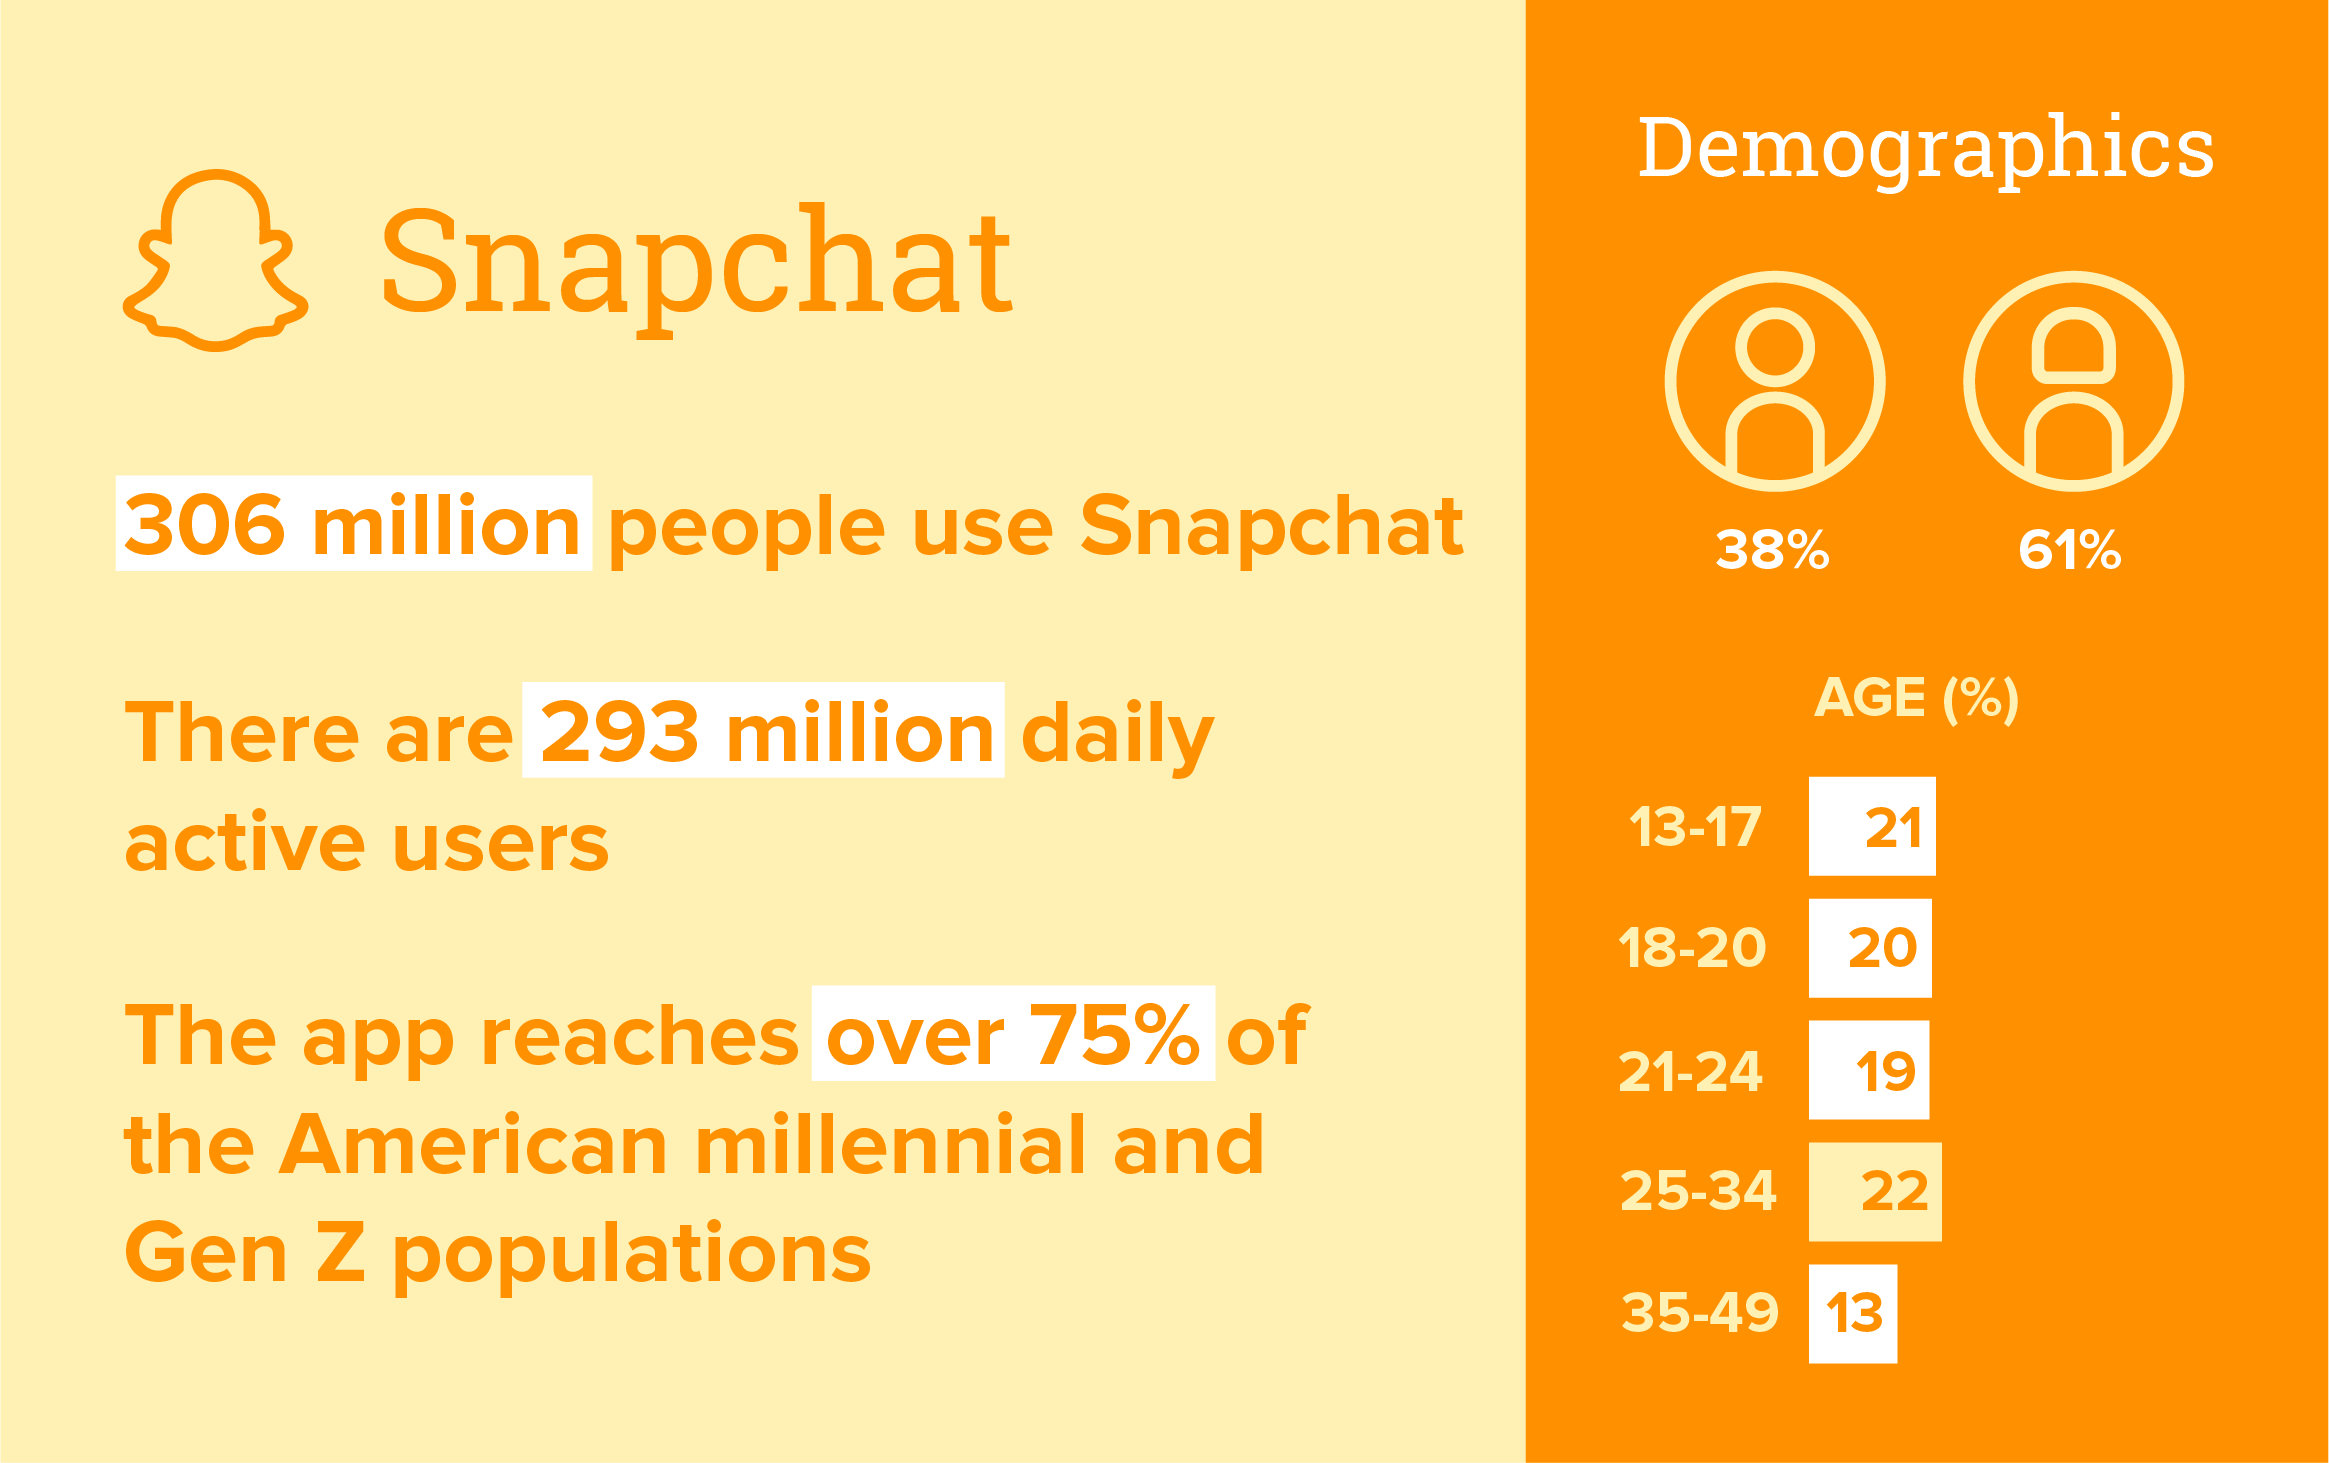
Snapchat is like that plant in the shade that gets no sun or water but somehow keeps growing. With its greatest influx of users in four years, Snap’s 2021 Q2 number of monthly active users hit 293 million—87 million more than Twitter. This growth can be attributed to Snap’s commitment to innovation—let’s not forget where Instagram Stories came from. With a focus on cool AR usages and a healthy dose of competitive appropriation (it’s about time Snapchat hit back), Snapchat is experiencing more success than ever and looks to be part of this blog for years to come.
For marketers looking to engage audiences under 25 years old, Snapchat is used by 75% of the American Gen-Z and Millenial market, making it a great alternative to TikTok.
Here are some more 2022 Snapchat stats for marketers:
- 67% of Snapchat daily active users are located outside of North America.
- Over 200 million daily active users engage with augmented reality features.
- The average user spends 30 minutes on Snapchat each day.
- 32.7% of American marketers include Snapchat in their marketing stack.
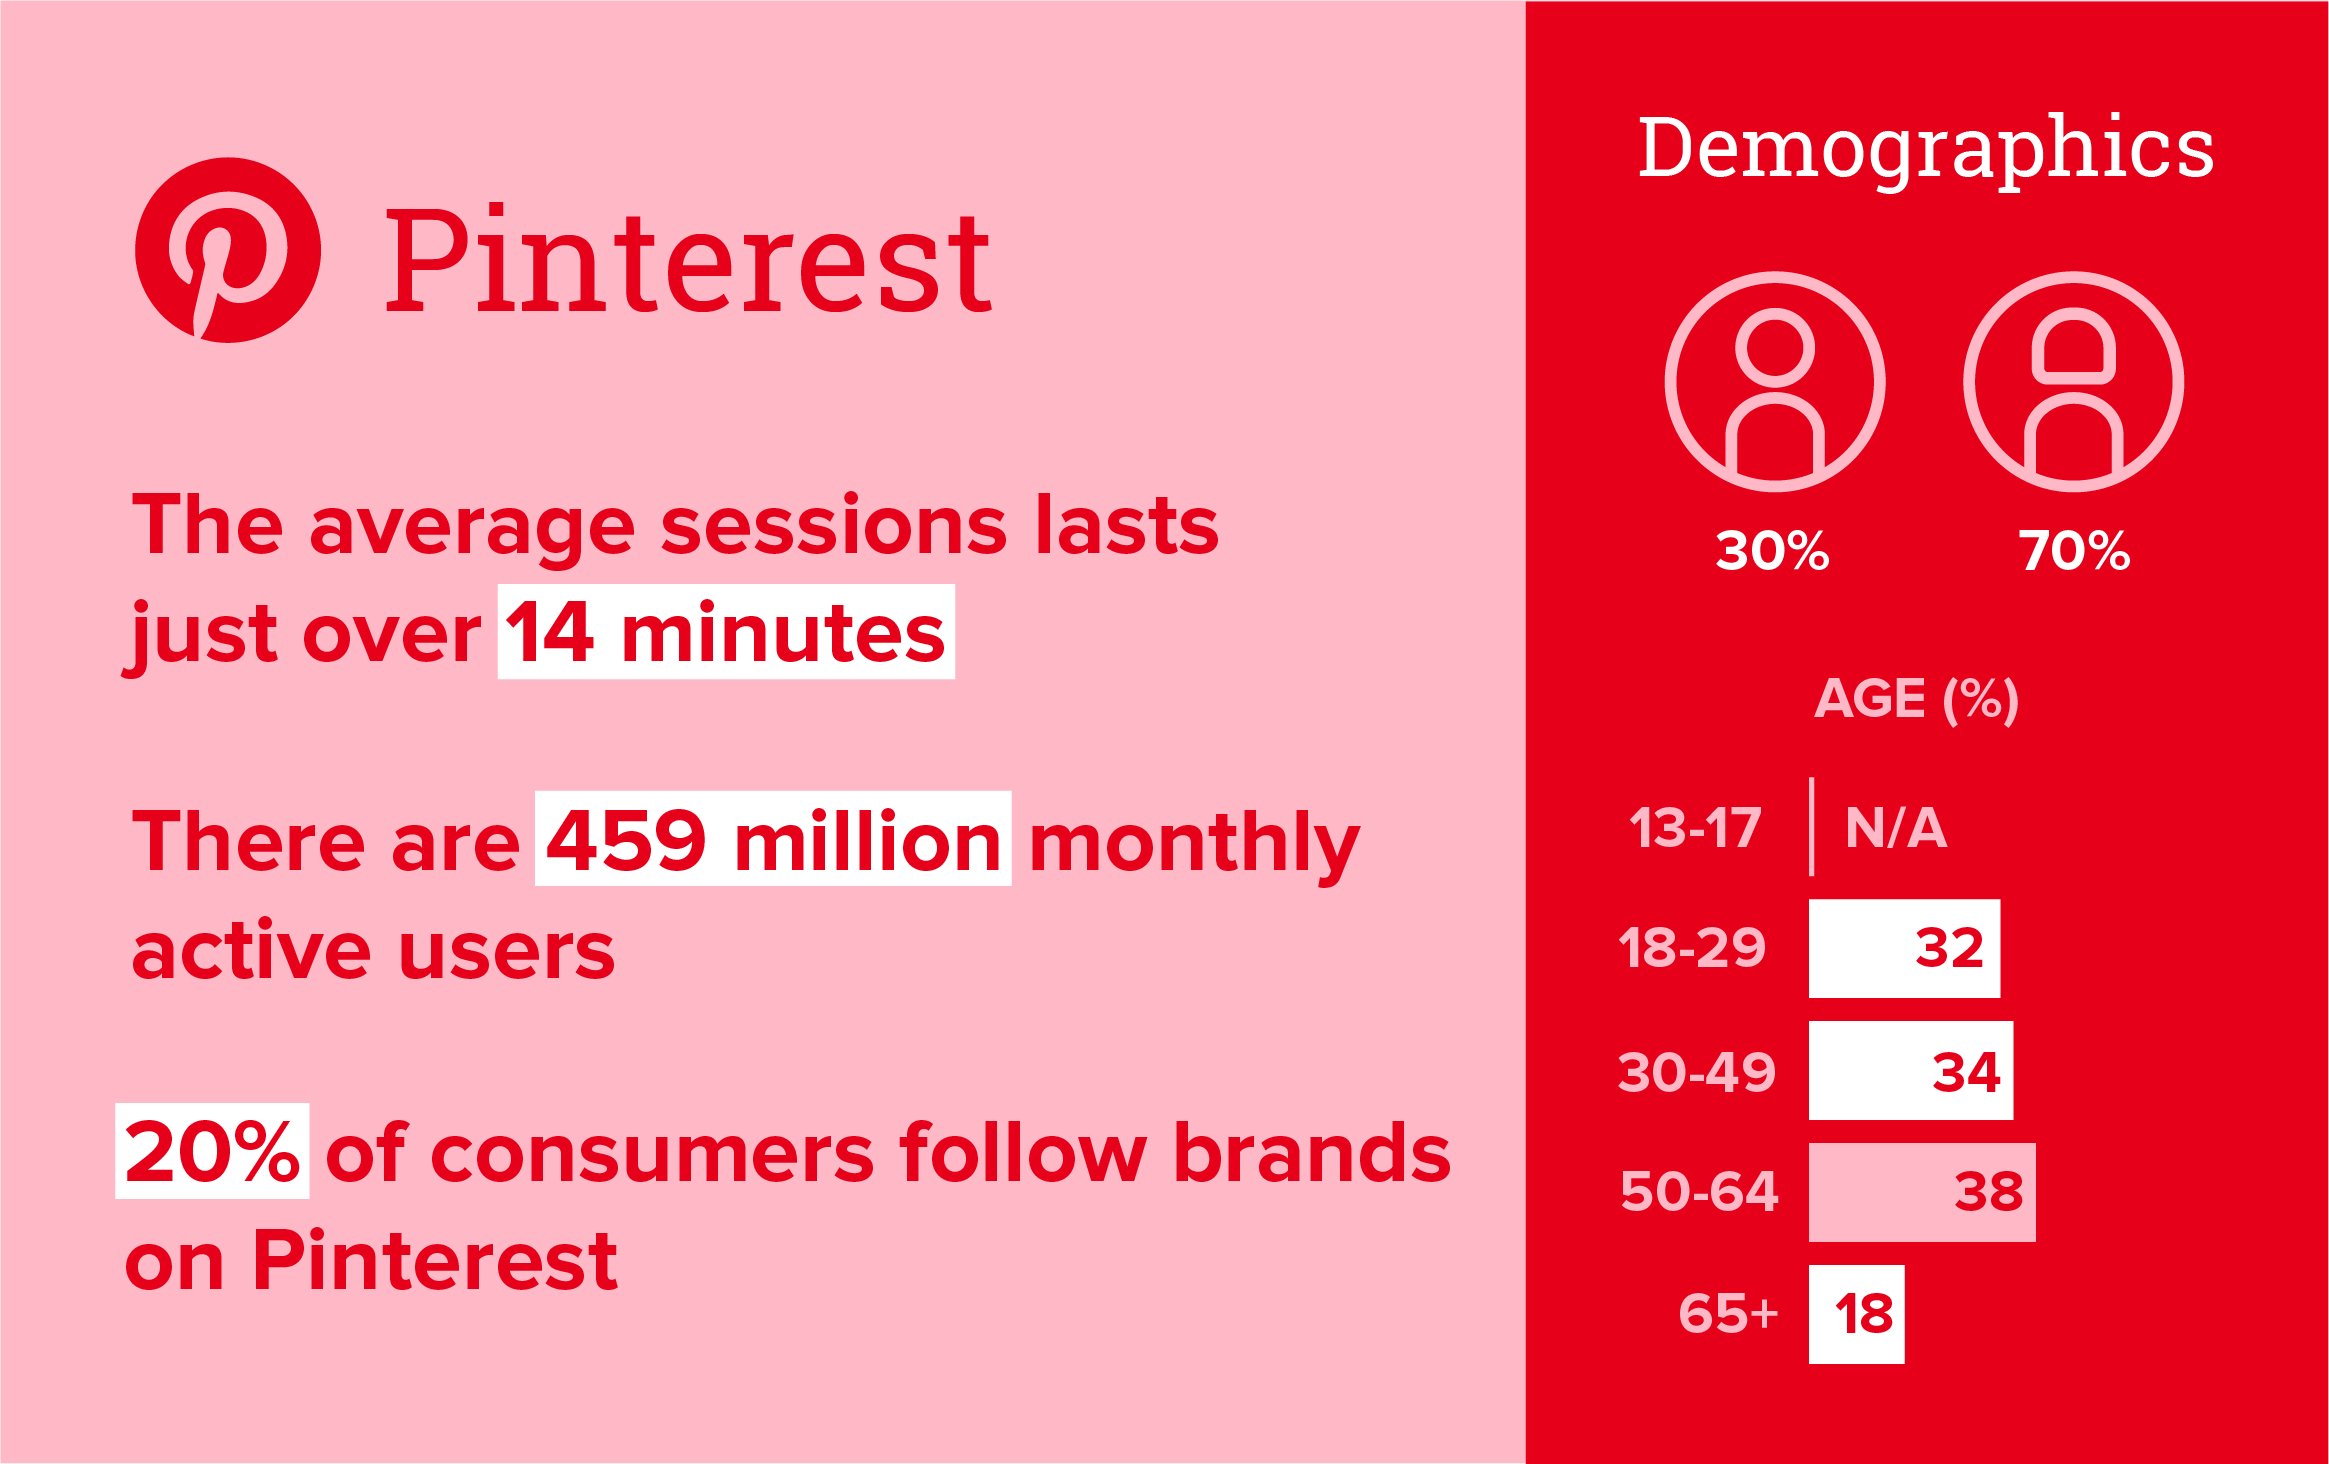
Pinterest is not for everyone. It’s great—for a handful of specific industries. Food and Home Decor are the most popular categories, followed by Travel—which is why “holiday” is the most popular Pinterest search term. With Weddings and Beauty also on the list of popular categories, it’s not a total shock to learn that 439 million pins were saved for Valentine’s Day each year.
No social platform has a bigger gender disparity than Pinterest, with 70% of its audience identifying as female. Unlike the majority of platforms on this list, Pinterest is the rare platform being used more by people over the age of thirty than under the age of thirty.
Here are some more 2022 Pinterest stats for marketers:
- 50% of users have made a purchase after seeing a product featured in a Promoted Pin.
- 85% of users use Pinterest for inspiration before starting a new project.
- 98% of users say they’ve tried new things after seeing them on Pinterest
- 25% of marketers use Pinterest in their marketing stack.


